Etrader-forex
In conclusion, I LOVE it! the Relative Strength Index (RSI 14) is a vital tool for forex traders. It assists in identifying potential reversals, confirming trends, managing risk, and making more informed trading decisions. However, it's important to remember that no indicator is foolproof, and it should be used in conjunction with other analysis techniques to...
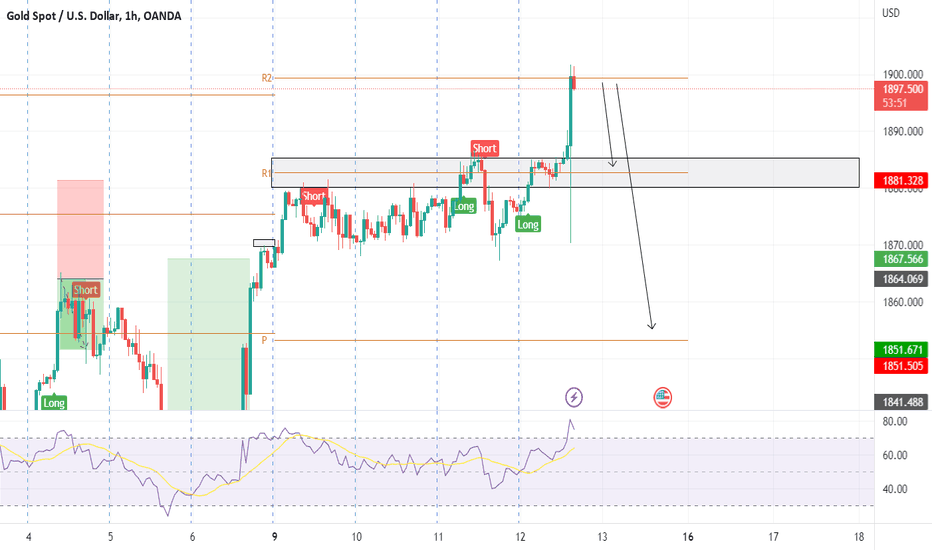
RSI indicates that we have an overbought price on gold. Those are great conditions to sell gold.
Will the Eurusd support price at 1.05 hold or break? what do you think?
Eurusd price has struggled to break resistance at 1.066 until 3/11. This week if 1.066 support will hold we are looking at 1.078 as our next level of resistance in our up trend.
Gold at 15M time frame has a resistance at 1850 that will push to a short position filling the gap from Monday's opening. Tp1-1842 Tp2-1825
Eurusd 1H short trend channel analysis with a possible buy point until 1.058.
Pullback Setup for EUR/USD bullish upswing and is now trading closer to the 1.0650 zone 23.6% Fibonacci.
Short position possible by the double top from Oct 22. in addition to short inc in the top of the trend channel.
In the 1W chart, Our trendline analysis identifies a possible short position in progress until 12,680. we will update :)
Possible DXY Pullback analysis using Fib&1D chart after receiving sell indicator at 50% or 61.8%
Gold sold and on his way to 1812 to hit last Mar low point
After a 3 week rise and hitting every SL gold is ready to go down and correct. SEE RSI levels
Etarder trading EURUSD with Ai indicator + RSI indicator : 1. 15M chart 2. R1/R2 sell 3. S1/S2 buy 4. 1:1 risk management very important! this does not investment advice and It cannot replace professional investment advice. have a great weekend
Etarder trading gold with Ai indicator + RSI indicator : 1. 15M chart 2. R3/R2 sell 3. S2/S3 buy 4. 1:1 risk management very important! this does not investment advice and It cannot replace professional investment advice. have a great weekend
According to 1 day analysis and RSI ind gold is overbought, after green usd data the short position will start to take place
The second video related to fib pullback and Rsi ind. It's important to : 1. identify your tend 2. set the trend line 3. use RSI and Fib to take sell trades
with the Eurusd chart this video will explain how to : 1. Identify sell trend (LL, LH) 2. take a trade with Fib Pullback
Eurusd ABCD chart pattern trading ideas. If the bearish trend will continue this week.


