FX-CHART-BOSS
PremiumOn the 4-hour chart, GBP/JPY is showing clear signs of a renewed bullish trend: Higher-highs & higher-lows Since mid-July, price has been carving out a staircase of successive peaks and troughs. The latest swing low around 197.30 held firm, and the subsequent rally cleared the June–July consolidation high near 198.40. Breakout and retest Price broke above a...
Overall Structure & Trend Over the past several 4-hour candles, BTCUSD has carved out a series of higher lows around 116,500–117,000 and higher highs around 120,000–120,500, defining a gentle up-sloping channel. The current price (118,758) sits just above the middle of that channel, suggesting there’s still room toward the upper trendline before meeting heavy...
On the 4-hour chart, AUD USD has recently shifted into a shallow up-trend after carving out a higher low around 0.6480. From that support zone, price has rallied through a short-term descending channel, breaking its upper trendline just above 0.6500 and holding that breakout on the last two candles. The entry at 0.65231 sits just above a cluster of prior...
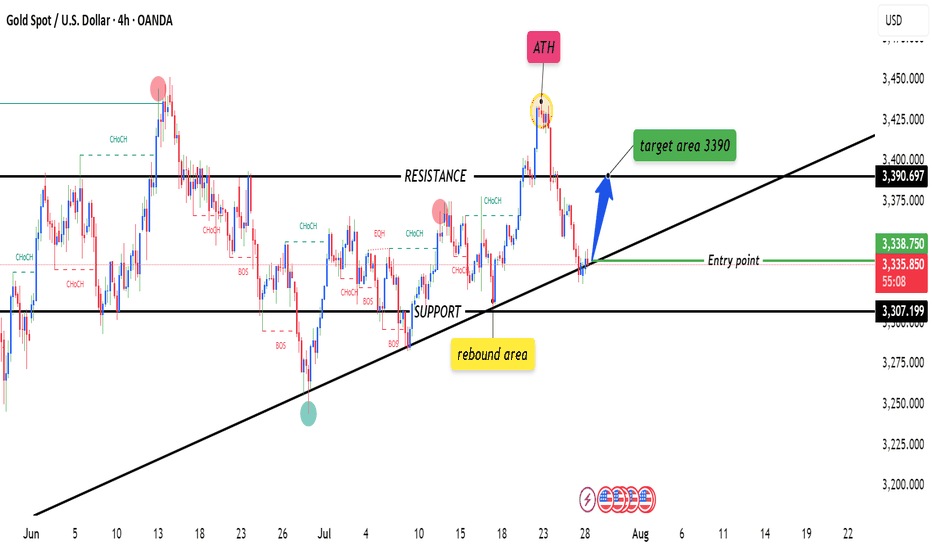
On the 4-hour chart, XAUUSD has recently pulled back into a well‐defined demand zone just above 3 330, offering a low-risk entry around 3 338. Here’s how the setup looks: Trend Context • Over the past week, gold has carved out a gentle up-slope, tracing higher highs and higher lows from 3 300 up toward 3 395. • Price dipped back to test the rising 50-period...
Currently bearish on the 4-hour chart with lower highs and lower lows forming consistently. Price Action: BTCUSD recently broke below a key support zone around 116,000, turning it into a fresh resistance. The market shows bearish momentum as price fails to reclaim above that zone. Candlestick Patterns: Multiple bearish engulfing candles confirm selling pressure...
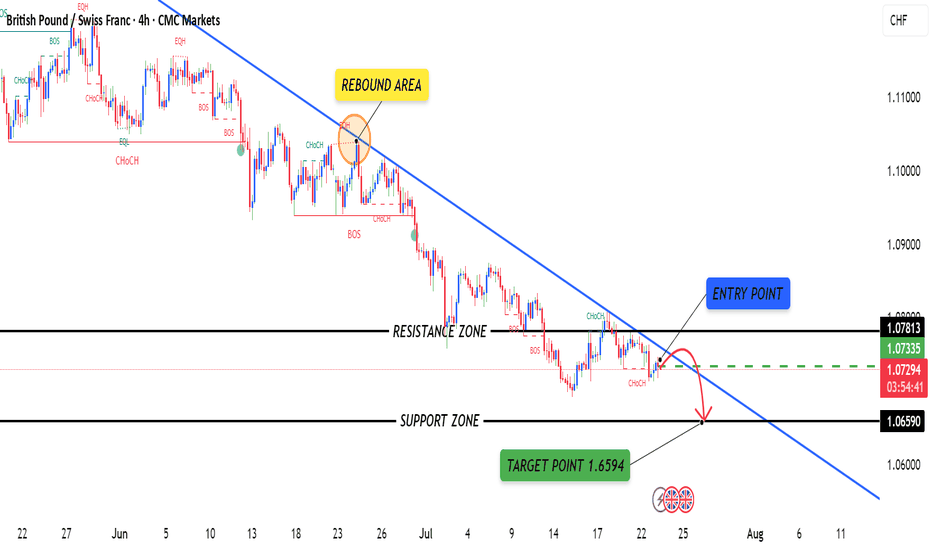
GBPCHF is currently in a downtrend, confirmed by a series of lower highs and lower lows. The pair has recently formed a bearish engulfing candle below the minor resistance zone near 1.07400, signaling renewed bearish pressure. Price rejection from the 50 EMA suggests sellers are still in control. RSI is trending downward, staying below 50, indicating bearish...
On the 4-hour chart, GBP/JPY has been tracing out a clear up-trend over the past several weeks, marked by a sequence of higher highs and higher lows. Your proposed long entry at 198.632 neatly coincides with two layers of support: Trendline support: A rising trendline drawn off the last two significant swing lows intercepts right around 198.6, suggesting the pair...
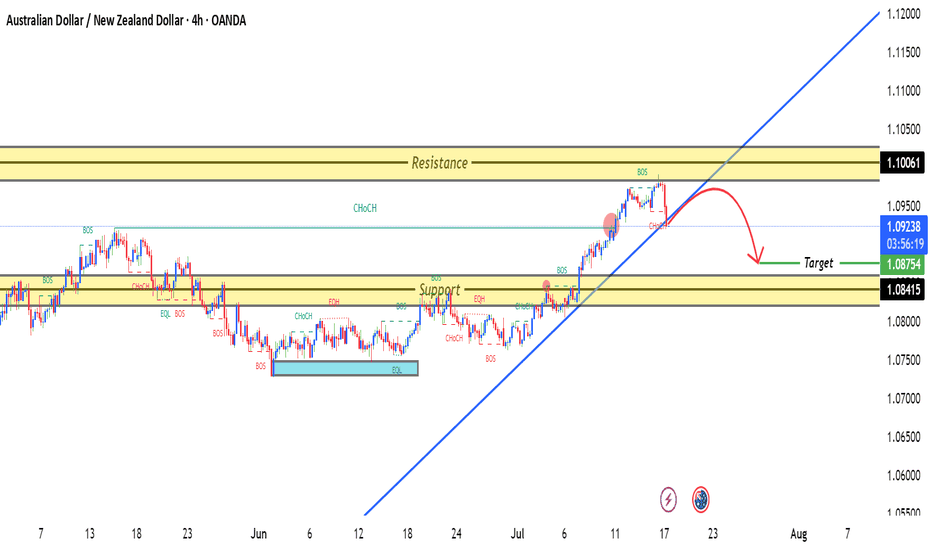
AUDNZD is currently in a short-term downtrend on the 4-hour chart. Price has been forming lower highs and lower lows, confirming bearish pressure. Recent candles show rejection at higher levels, supporting downside continuation. 1.09400 – 1.09550: Strong resistance zone where price was previously rejected multiple times. 1.09380 (your entry) aligns with a minor...
ETHUSD is showing bullish momentum on the 4-hour chart with a strong structure to support further upside. The setup targets a potential continuation to 3,718.8, with protective risk control below 3,250.4. Watch for a clean break above 3,540 to accelerate the bullish move.


