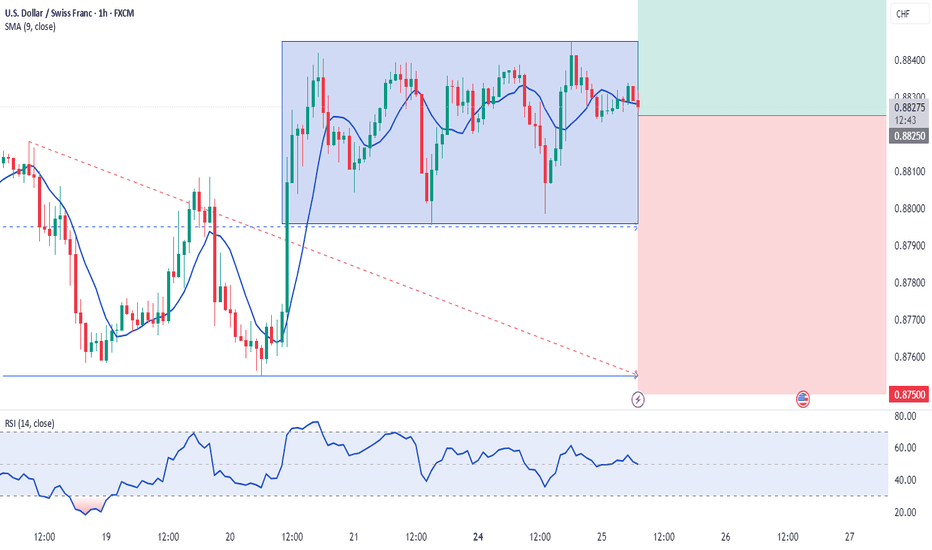
BUY 0.88250 | STOP 0.87500 | TAKE 0.89250 | Technically, the price is likely to go up beyond the boundaries of the formed lateral local movement and consolidate above 0.88450, followed by a move to the level of 0.89250. The momentum is expected today on the publication of statistics from the United States. the indicators do not contradict this scenario.
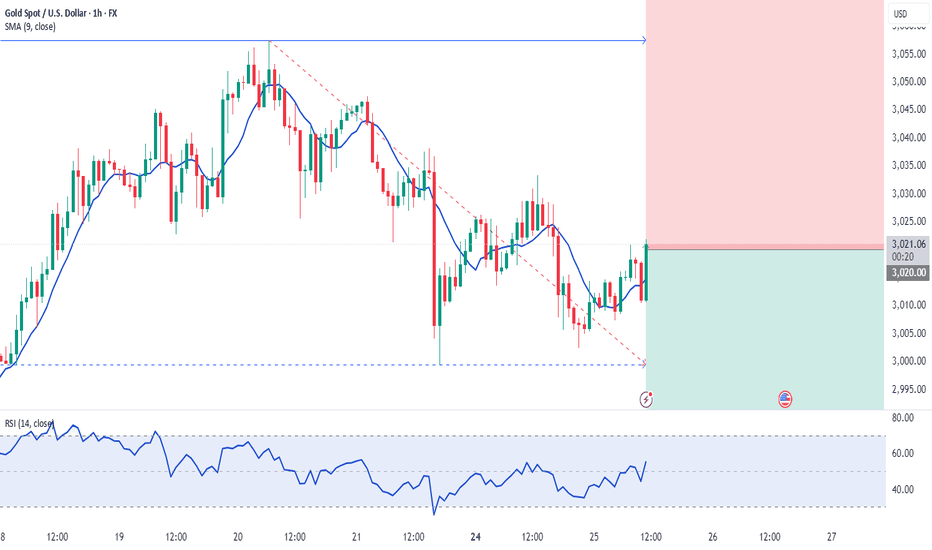
SELL 3020.00 | STOP 3065.00 | TAKE 2960.00 | Let's consider the scenario of a downward movement after the price is firmly fixed below the 3000.00 level.
BUY 20.0300 | STOP 19.8700 | TAKE 20.2300 | Local upward movement.
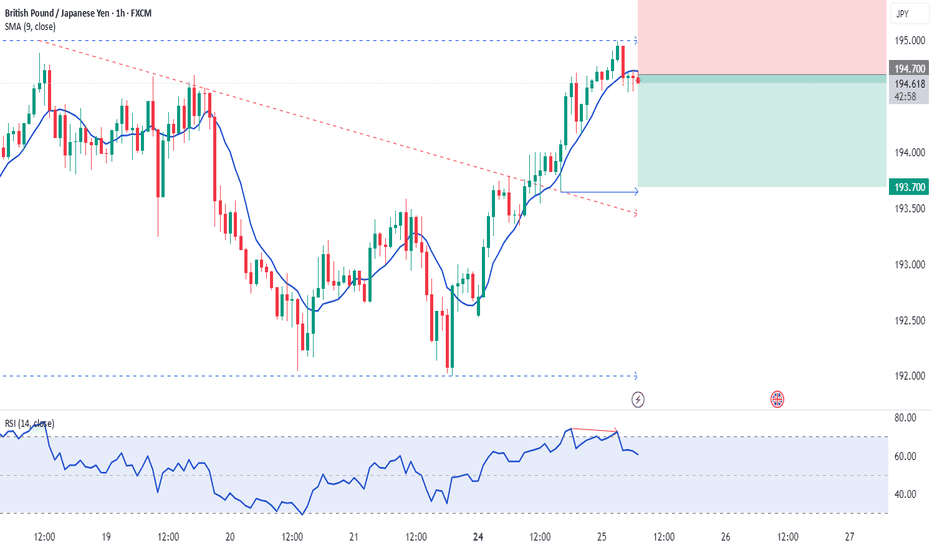
SELL 194.700 | STOP 195.500 | TAKE 193.700 | We assume a corrective downward movement to the nearest range of local support within the framework of the main upward medium-term trend.
BUY 1.71800 | STOP 1.71300 | TAKE 1.72400 | Movement in the formed range.
SELL 1.09100 | STOP 1.09650 | TAKE 1.08400 | The price continues to consolidate near the strong resistance range of 1.09250-1.09500. Today we expect a corrective downward movement.
SELL 33.9000 | STOP 34.3000 | TAKE 33.3200 | We expect the price to move down from the local ascending channel near the medium-term maximums to the nearest support level in the area of 33.3200-33.0500.
SELL 104.300 | STOP 105.100 | TAKE 103.300 | Let's consider the local reversal model of the price movement down from the current levels towards the support levels of 103.650-103.300, which were the previous maximum.
SELL 33.7700 | STOP 34.1800 | TAKE 33.2200 | Corrective movement.
SELL 1.14350 | STOP 1.14730 | TAKE 1.13850 | The downward direction.
SELL 162.000 | STOP 162.500 | TAKE 161.300 | Intraday movement signal from local resistance.
SELL 103.550 | STOP 104.100 | TAKE 102.880 | Trend channel movement.
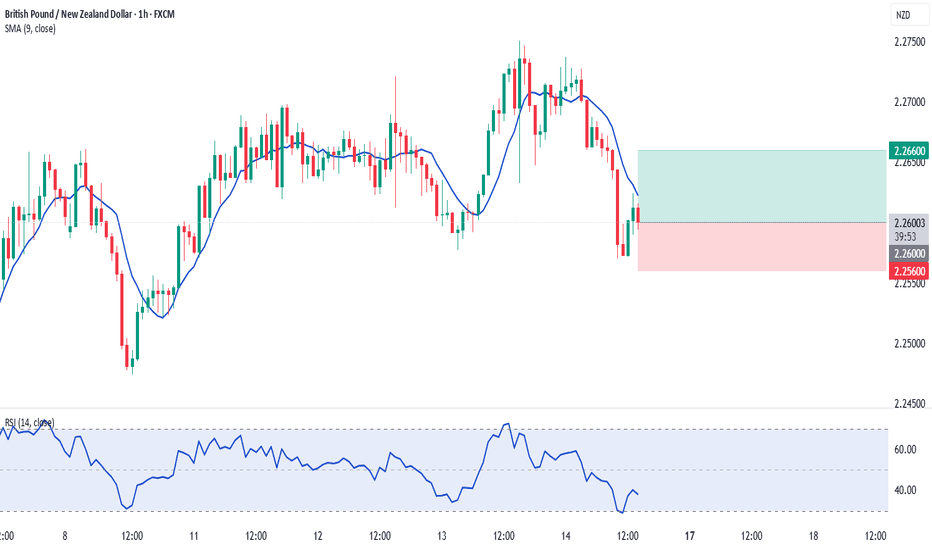
BUY 1.26000 | STOP 1.25600 | TAKE 1.26600 | Upward movement.
SELL 0.96300 | STOP 0.96700 | TAKE 0.95800 | Movomebt from local reristance level.
SELL 33.8500 | STOP 34.2000 | TAKE 33.4000 | Downward correction movement.
BUY 1900.00 | STOP 1740.00 | TAKE 2100.00 | After a smooth and prolonged decline, we expect a local increase in prices to the levels of 2100.00 - 2150.00.
SELL 1.29600 | STOP 1.30100 | TAKE 1.29000 | We expect a short downward movement to the local resistance level before resuming the pair's increased growth. Technical analysis shows an increased buy signal from the range of 1.29000 - 1.28700.
SELL 2945.00 | STOP 2965.00 | TAKE 2920.00 | Gold shows an interesting picture of the dynamics of price movement. The range near the absolute maximums is expected to be very active until the end of this week. So given the serious resistance ceiling, the price is probably going to the lows of this week.


