After a big drop and several sharp price swings in Indusind Bank Ltd stock, it's now near a strong long-term support level. A patterns, an Opening Wedge, can be seen on the charts. It looks like a good opportunity to add on a bad day. The Volume Profile also suggests a good accumulation Zone.
Deepak Nitrite Ltd Stock trading around support, Followings are the observations: Multiple Parallel Channels Opening Wedge or Gramophone Pattern Diamond Pattern
Something exciting is happening with Ashok Leyland Ltd! On the daily linear chart, the stock has been stuck in a range since 2021, forming a complex Bow & Tie pattern. This pattern typically has 7 or 9 waves, and we're now in the final 9th wave, signaling a potential breakout after the completion of the 9th wave. Ashok Leyland could be a great pick on a dip!
Future Stoch Pharma Sector Syngene International Ltd Make or Break levels in Syngene International Ltd's technical chart. Supports & Patterns Spotted: Parallel Channel Rising Wedge Pattern Support Zone Anchored VWAP Volume Profile Law Of Polarity 600 & 570 are good Support levels. Note: This analysis is for educational purposes only and is not intended as a...
Pharma Sector Stock Leading API (Active Pharmaceutical Ingredients) Manufacturer IOLCP (IOL Chemicals & Pharmaceutical Ltd) Technical Analysis After 70% correction from ATH supports visible in IOLCP: Parallel Channel Law of Polarity Volume Profile Anchored VWAP RSI
Since 2001, Wipro Ltd has been moving within a three-part divided parallel channel. The monthly chart highlights a major polarity zone, suggesting that the stock is currently near a significant support level. On the daily timeframe, Wipro is also forming a rising wedge pattern, with the price hovering around another strong support zone.
A strong long-term support level on Voltas Ltd.'s monthly log scale chart, which has held firm since 2000. Using this support zone. It's a straightforward chart with simple technical analysis.
This sugar stock has all the makings of a multibagger! It experienced a downtrend starting in 2006, followed by a 12-year sideways consolidation period from 2011. During this rangebound phase, a massive 12-year Head & Shoulders pattern formed. The stock broke out in 2023 and is now retesting that breakout level. Everything is lining up for potentially huge returns...
ABFRL's chart is showing a lot of positive signs. On the monthly timeframe (linear chart), the stock has been taking support from levels dating back to 2020. There's also support from one of the key EMAs, and the Volume Profile suggests accumulation in this zone. To add to that, the monthly RSI is also holding at a strong support level.
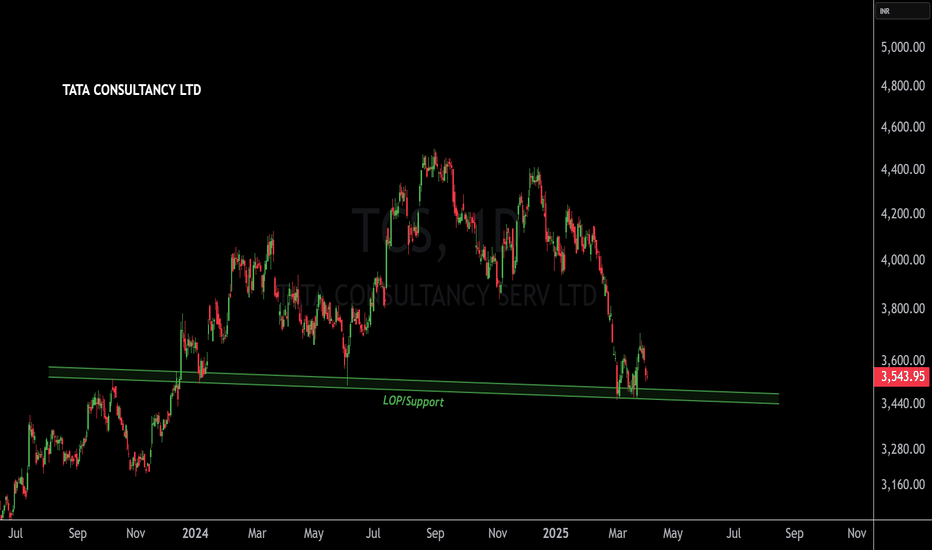
TCS, a blue-chip stock, is currently trading at a support level.
A diamond pattern has been spotted in the AUDUSD forex pair, with the spot price currently trading near the support level of the pattern.
Mahindra Lifespace Developers Ltd has seen a 56% correction from its All-Time High, yet it hasn’t delivered any meaningful returns compared to its peak in 2007. Stock is currently at a Law of Polarity support. 300 to 280 looks like our adding range.
A head-and-shoulder pattern has been forming and playing out since 2018. The larger the pattern, the bigger the potential target. A successful retest of the neckline further strengthens the pattern, and the weekly RSI is showing positive convergence with the price action. This indicates strong potential for good returns in the stock in the near future.
After a significant 55% correction from its All-Time High (ATH), Birlasoft stock is trading near a key support level. While the current price of ₹395 looks attractive, a better entry opportunity could arise in the ₹370 to ₹330 range if the stock sees further correction.
On Linear scale chart, ETHUSD is around the support zone working since 2020. there is another parallel channel working.
On Linear chart one support zone is working after 64% correction, The good Support level based on the log and linear scale chart is 277 to 245. If it breaks 250 there will be more downside till 160-145levels. There are other things also working on Log Chart as well.
After 47% correction, Intellect Design Arena Ltd trading in a parallel channel and there is a EMA support. The current price of 670 seems good, but the range of 600 to 550 looks great for adding, stock can achieve new heights in a 1 to 1.5-year duration.
Bajaj Consumer is showing long-term support, potentially forming a symmetrical triangle. The current levels appear to be a strong support zone, but the stock could further correct to the ₹150–₹140 range, based on unadjusted and linear scale charts.


