Key Observations: Resistance Zone (~95,963 - 97,880 USDT) Price previously rejected this zone. The red highlighted area with a downward arrow suggests a potential short setup. Support Levels: 91,414 USDT (current resistance-turned-support level). 80,223 USDT (next major support). 72,848 USDT (critical lower support). 200-Week Moving Average (Red Line)...
1️⃣ Market Context The chart is showing a Head & Shoulders (H&S) pattern, which is a bearish reversal pattern. The price has broken below the neckline (black trendline), confirming the pattern. A retest of the neckline is occurring, which could lead to further downside. 2️⃣ Trade Setup Breakdown 🔹 Pattern Breakdown: Left Shoulder: Formed around 0.8410 -...
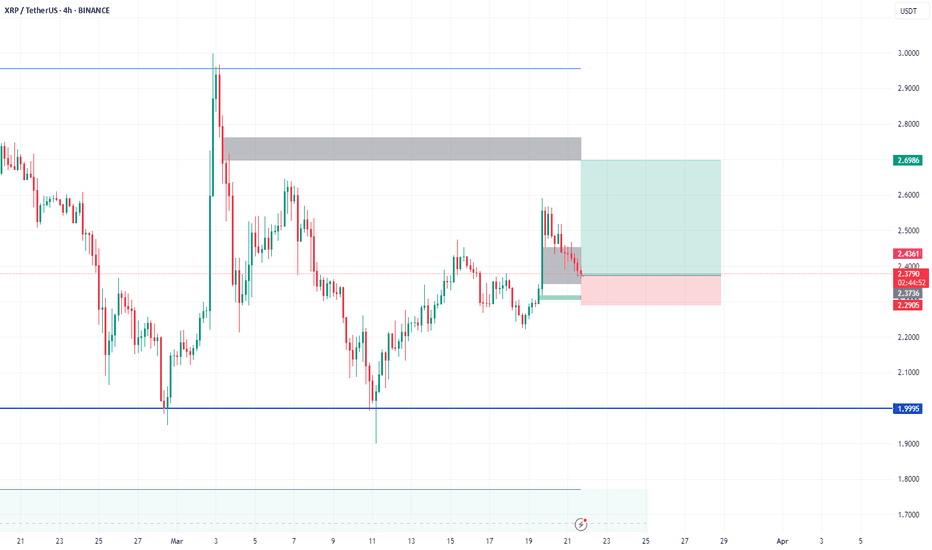
Trade Analysis of the Chart 1️⃣ Market Context The chart displays a long trade setup with risk management in place. The price is currently consolidating near the entry zone after a recent bullish move. A gray supply zone at the top suggests potential resistance. The risk/reward ratio looks favorable (green zone = profit target, red zone = stop-loss). 2️⃣ Trade...
In this chart i have shown a buy setup with ICT and my secret Methodology that 110% works always the time i hope you will get some good profit.inbox for more details
In the chart you can see that USD JPY has break the support with increasing volume and going to retest that support (now resistance ) with low volume and it is better opportunity to sell that pair because it is giving now best risk and reward ratio.
EUR AUD short Term Sell trade in D1 Time Frame as we can see up thrust in daily Bar is closing on its low and increasing volume , it is all about VSA technical analysis. #eur #aud
In this chart price break the support with increasing Volume and retest the level with Low Volume which is clear indication of sell trade. best of luck.
in daily time frame down trend channel on upper tail we found sow up thrust .
Short XAU as VSA low Volume Indication as No demand
Dollar is gaining strength price and OI comparison and XAU OI is showing bearish sign so it is quite possible that it will go short.
in this setup if today bar closed as (Shake out) mean off the high then the price will go for long according to D1 setup ,it is basically range base trade.
I was entered in the market at 4th touch but unfortunately i am unable to upload external link from which i show you the basic vsa idea but in future ill keep sharing my ideas, in my next idea ill share complete entry setup my all setups and ideas are VSA based.
As you can watch my previous chart as i told you about the price it was move and now i am updating the signal at next level watch in chart and please compare previous and this chart to so you can better understand.
As per my thinking and experience if GBP AUD close above today 1.86533 then it will further move for 1.87735 next resistance.
As i have draw the support and resistance level and trend line i think AUDUSD will fall back in coming week because it is facing strong resistance.


