Forex_
In my analysis of GBP/AUD as a swing trade from the 1Hour to the Daily price will retest the Support at .382 on Fib. Price is currently bouncing off of the 36EMA. Then price to move to next higher high of .236 on Fib and price $1.83800. Then price will retrace to 0 on the Fib then move to the daily resistance price of $1.84157. Price action, Fibonacci & 36EMA were...
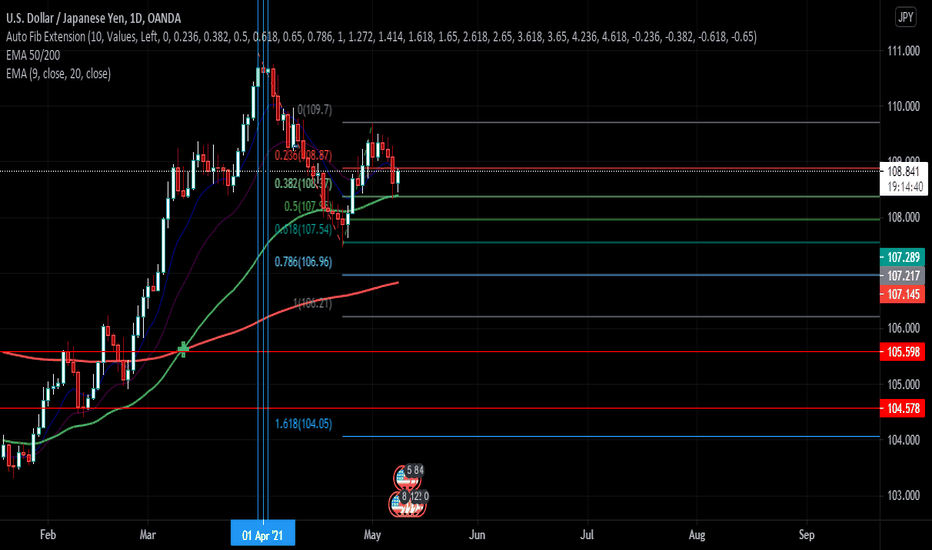
In my analysis of USD/JPY . Price is at the Resistance Zone and has completed the Teacup Chart Pattern. Price should complete the pattern by forming the handle and sending price to the Support zone to price $109.217. I used price action & chart patterns to make my analysis. OANDA:USDJPY USD/
In my analysis of USD/JPY, this currency pair on the daily chart is currently creating a lower low. The head and shoulders pattern has been created on the chart and price is currently breaking below the right shoulder. I forecast price to reach the price $107.00 for the next lower low. I used the Fibonacci with the 9, 20 & 50 Moving Averages. OANDA:USDJPY
In my analysis of USD/JPY, this currency pair is moving Bullishly. On the daily, I forecast that retracement will occur around price of $109.728 before moving to $110.738. I use the Fib and MA 50 w/support and Resistance to as confluence. OANDA:USDJPY
In my analysis of USD/CAD. This currency pair is moving Bearishly on the Daily Chart. Currently retracing at price $1.22862. I forecast that the pair will receive the next lower low at $1.2200. I used the Fibonacci and the 50 MA to analysis the charts. OANDA:USDCAD
In my analysis of NZD/USD, this currency pair is moving Bullishly on the Daily Chart. Currently the pair is in area of resistance at price $.72442. If prices breaks above the area of retracement, I forecast price to move up to price $.74282. If price breaks below the area of retracement, I forecast price to move to price $.70684. In my analysis, I used the...
In my analysis of GBP/JPY, this currency pair is currently moving Bullishly. I forecast that the market will move to price $152.919. I analyzed the Daily chart, using the 50 MA, Fibonacci and Support/Resistance. OANDA:GBPJPY
In my analysis of EUR/CAD, this currency pair is currently bearish. The pair currently retracing at price $1.48825. I forecast that price will fall to $1.47287. On the Daily Chart, I used the Fibonacci and the 50 MA to reach my analysis as well Support and Resistance. OANDA:EURCAD
In my analysis of Eur/Usd, this currency pair is in an uptrend. I forecast the next higher high to peak at price $1.21910. For confluence I used trendlines, Demand & Supply Zones, 50MA and the Fibonacci. OANDA:EURUSD
In my analysis of US 30, this index is in an uptrend, currently retracing hitting it's higher low. I expect for the next higher high to hit the price of $34800. In my analysis, I used the Fibonnaci, the 50 MA and the Trendline. CURRENCYCOM:US30
In my analysis of JPY/USD. This Currency Pair is moving in a Bearish Trend expected to continue to price of -.00904. I used the 50 MA and Supply and Demand Zones on the Daily Chart. FX_IDC:JPYUSD
In my analysis of US 30. The Index is moving in a Bullish Trend expected to retrace at price 33700 then continue to price of 34250. I used the Fibonacci Extension to reach my analysis on the Daily Chart. CURRENCYCOM:US30
In my analysis of JPY/GBP. This currency pair is currently in a bearish trend moving toward the price of .006529 on the Daily Charts. I used Supply and Demand Zones to analysis the charts per price action. FX_IDC:JPYGBP
In my analysis of JPY/USD. This currency pair is moving in a bearish trend expected to hit the support zone at 009025. I used Supply and Demand Zones for my analysis. FX_IDC:JPYUSD
My analysis of US 30.... Using the Daily Chart, the US 30 will continue trending to price 31732.72 via using the Fibonacci. I used the Williams Alligator and the MA 50 for Confluence. The price is also above the 50 MA. CAPITALCOM:US30
My analysis of USD/JPY... From the Daily Chart.. The trend will continue to price 105.77. Using the Fibonacci Retracement & Williams Alligator for Confluence. The trend is also above the 50 MA. OANDA:USDJPY
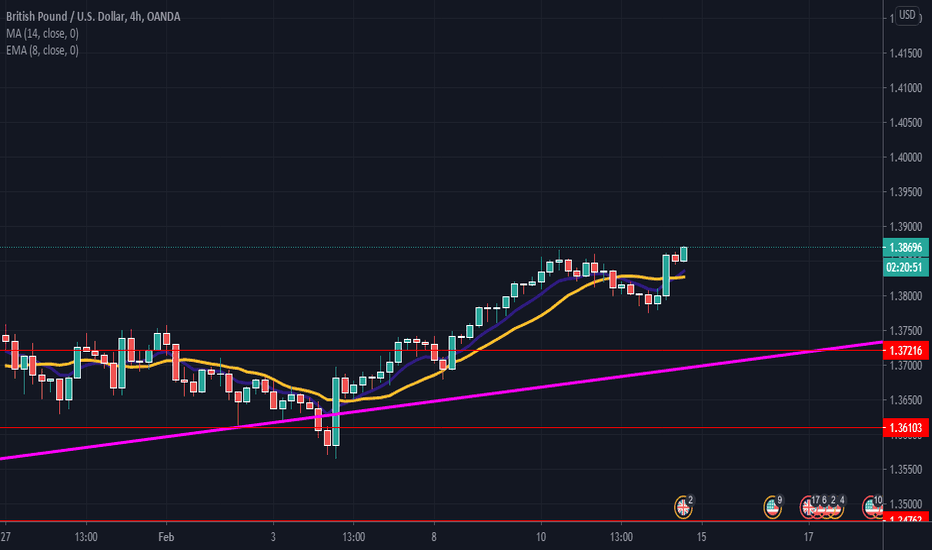
In analyzing GBP/USD. The market is trending upward toward price of $1.39727. The market is above the MA 50 on the daily chart as well the MA 9 & 14 have crossed upward on the 4 hour chart. OANDA:GBPUSD
My analysis of Nas100 . The Nas100 will retrace to price $12995.12. Using the Fibonacci Retracement tool. Analysed past price movement as confluence to Fibonacci Retracement tool. TVC:NDX


