as market cap increases, volatility decreases. The chart shows the channels both getting a tighter spread and angle of acceleration getting lower. My outlook is we still see a 5th wave to the mid line of the current channel, before breaking down and creating another channel with tighter spread and angle. This is just an idea, based of technical structures and...
A chart of the Hedera governing council members joining to date.
Please refer to chart for analysis. I am still very bullish on this coin, considering the latest fundamentals check the recent news, on www.hedera.com. This chart also looks solid for continuation imo.
Just for interest, on the history of Hedera up until this point
Using a pi cycle top indicator adjusted to hbars local ATH, and a bars pattern from the previous run up, we get some confluence, maybe suggesting a huge impulsive wave is coming.. Time will tell
Highly speculative price prediction, if all the stars align for the next few months. What if..?
Matic looks ready to test ATH, its broken out of its acending channel and mid point Channel line in its larger structure, it has retested the breaks and now hanging around local ath, waiting for a break
When ADA starts closing daily candles above that mid line channel, there is gonna be explosive price action, looking at targets near 3 dollars. Only a matter of time.
After a beautiful Elliot impulse, followed by ADA respecting the corrective contracting triangle ABCDE. The Last Leg E was interrupted due to the btc mania that went on today, with price breaking up and setting some ugly bearish divergence on the macd and rsi which could have been avoided if we finished leg E. This makes me think that this move was a little...
ADA Idea. Not investment advice. note: A break below lower trendline, due to a major btc drop, could see us testing btw 27-28cents, which would probably be a spring board type event double bottom, we wont stay at those prices for long if it does happen.
I am quite bullish on ada. After bouncing off lower trendline after correction, I am waiting for a break of the down trend for price to either flythrough the upper trendline straight to 41 cents or to retest trendline and find support at the 34 cent level before moving higher. (Which depends on how much volume we get) Just my opinion. Not financial advice.
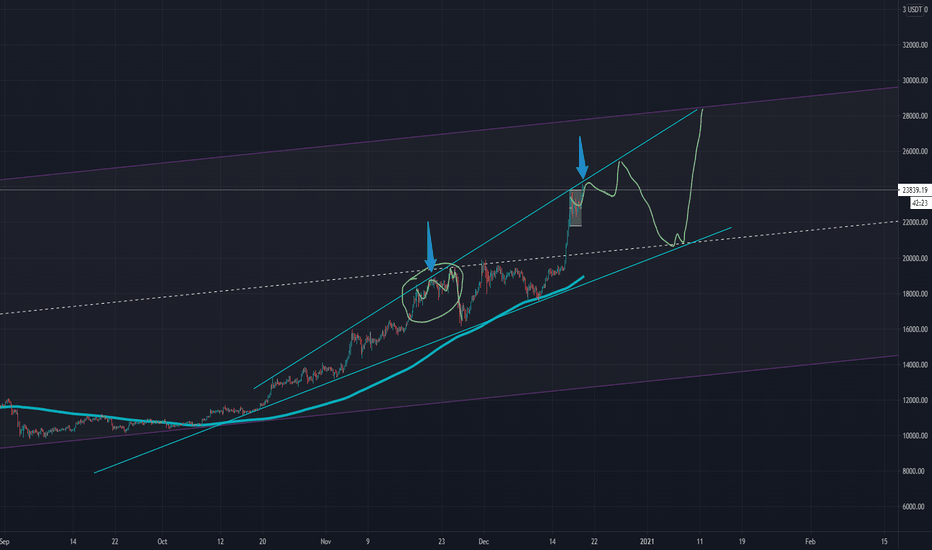
BTC has touched the top of its large ascending broadening triangle structure for the second time, similar to previous price action noted on the chart. Taking past action into account, this is a likely path, moving along the upper triangle resistance until a decent retrace to test both the bottom triangle support line, and likely the neckline break of 20000...
An idea of where price could head in short term
Price broke below the cloud but the lagging line clearly bouncing off the cloud, trend reversal not confirmed. Good entry for trend continuation.


