Fox666
Welcome for another grand update on Bitcoin part of THE BEAR MARKET CONTINUES PART VI Final Target = 2496.03 USD Potential bottom = 1647.96 USD Hidden GAP 1319.47 - 1814.76 USD Right Fibonacci Extension wave (c) Left Fibonacci Retracement wave (a) Why do I think we have completed sub wave c? There are many reasons. Fib-Time is 1.236. At the top we have the...
If today's candle closes at least on this target, this pattern is valid. Then with high probability we are at the top of the wave (b) and it will follow (c). If this formation is confirmed, I will show the target of wave (c). Fear&greed index was 90 yesterday. Ideally, this is the end of the US election, isn't it a coincidence?
The S&P 500 can fall by up to 50%. On the monthly we can see that we have a huge divergence for almost 2 years. Such a huge divergence cannot be overlooked. Therefore, I think the strongest support will be at 0.618 fibo retracement and there is also MA 200 monthly.
If we see a hard rejection in the coming hours or days, a new episode of THE BEAR MARKET CONTINUES will be released.
A huge falling wedge also formed on the XRP, similar to the BCH. This shows us that we will soon see a huge movement in the crypto market. Just do not know yet which direction.
In this chart, I want to show the important levels that will decide if the long-awaited bull market has already started. We have to wait for it to be confirmed. I'm not sure yet. We see that since April 29, 2020, we have been holding the growth trend line and at the same time the WMA 21 correlates with it. If we did not maintain this level and break it down, we...
LTC moves from its ATH in a huge descending triangle similar to BTC. If it pierces it downwards, the triangle transforms into a channel. If the economy comes to a halt thanks to global COVID measures, stock markets, oil and gold are likely to fall epic. Crypto copies these big moves. The LTC may test $ 4. Notice the fibo-extension on the right, how incredibly the...
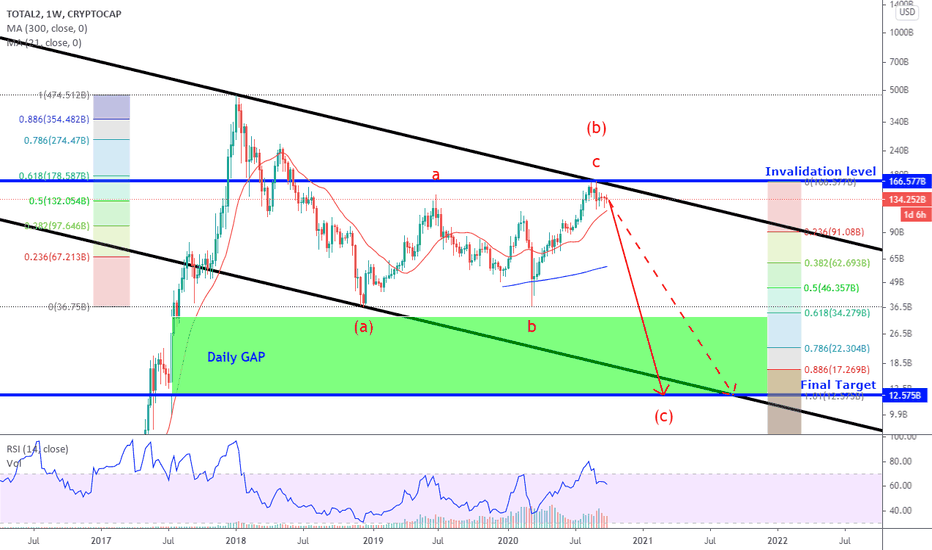
Most people will not be pleased with this analysis. After such profits as 100-500% on altcoins, probably few people will believe it. The current situation on the markets is very bad. According to this analysis, we have completed wave (b) of correction from the bull market, which ended in 2017. We are now in wave (c). If so, altcoins will fall by 90%. Don't believe...
Few people believe that we can still be in the bear market on Altcoins against BTC. This can still be just a correction. We still haven't beat WMA 200. We can see a bearish divergence on RSI. The Fear & Greed Index is 83. In order to talk about the bull market on Altcoins versus BTC, we have to overcome the Invalidation level Bearish scenario (red), WMA 200 and...
If we consider that we are in a bull market after a 2.5-year bear market, BTC must not fall below the Invalidation level of wave II (8830 USD). Ideally, we should not fall below $ 10,500. If they do not maintain this Invalidation level, then we are not yet in a long-term uptrend. If we maintain the invalidation level, we can grow to 24160 USD (wave III), 44284 USD...
We are in a triangle, which probably means we are in wave IV.
Currently we could be in wave III. If BTC breaks through $ 8,900, we'll see a big fall. If the BTC does not exceed 10500, the analysis is still valid.
Target Wave 3 - 1965 Target Wave 5 - 1500
Welcome for another grand update on Bitcoin part of THE BEAR MARKET CONTINUES PART V BTC will test 10 Year Moving Average (approximately 2500 USD in July 2020) Final Target 1 = 2203.66 USD Final Target 2 = 1636.72 USD GAP 1350-1830 USD Right Fibonacci Extension wave (c) Left Fibonacci Retracement wave (a) Wave (b) returned more than 61,8% of wave (a), it's wave...
This would mean a drop to 6000-6500 and testing weekly MA 200 and subsequent growth. After completing the right shoulders, a massive increase to $ 17,000 would follow (Wave III)
We have approached the trend line that intersects the peaks of 2019 and 2020. So far we have only created another lower high. If we overcome 10500 USD and especially the blue trend line that intersects the peaks of 2017 and 2019, then we can talk about a bull run. NVT indicator tests the trend line


