Bitcoin is currently hugging the range high. We grabbed liquidity above 50500 a few days ago, then closed back in the range. For me, a warning signal to keep an eye on. Price will now have to break above the range and close to continue the bullish price action. Should this not happen, I expect a bearish scenario and that is that we will take liquidity to the...
Price currently breaking out of the resistance zone . Also currently trading above the range as well. As long as we don't fall back into the range, BTC is very bullish . If the 1D candle closes above this zone 49K is next! Also Hash Ribbons indicator has given a new buy signal. Interesting indicator if you look at the gains of the past signals.
BTC cools down and goes sideways from here while BTC dominance is declining. That means altcoins have room to rise further. The less volatile BTC is the better this is for altcoins. On the chart we see that BTC has finally corrected and found temporary support around 43K. The price briefly fake-out of the range, but quickly recaptured it. Often we see that after...
As I indicated in the previous analysis, I expect a sideways move for bitcoin. After faking out and taking out the stops at 43K, this time late shorts getting rekt as the price rises to 52K. Price then closed back in the range and dropped again. As BTC dominance is dropping, this is the best environment for alt coins to perform at its best. Look closely at coins...
Check this out!! - Daily bullish divergence - Daily Engulfing Candle - At Weekly Support - Weekly hidden bullish divergence Moon mission has just begun!
Bitcoin rocketed from 14K straight to 16K where it found resistance. Een retrace is coming. And don't under estimate these retraces. They can go fast with a quick drop of -20/30%. These retraces have taken place more often in the past. Try not to short Bitcoin, but rather buy it at each dip. A new ATH is upcoming. To buy I look around the support zone: 12500 -...
At this moment it is very unclear which move BTC will make. However, there is a clear trend line that has been tested a few times already. Also a lot of liquidity has been created both on the bottom and the top that whichever side BTC chooses this will be a strong move with a lot of liquidations. For now it's best to stay on the sidelines and let alts continue...
-Demand zone - Channel EQ - Potential Hidden bullish divergence Demand zone entry: 6.9 - 8.1 But if we drop through the Weekly demand zone, I expect a dump to 4-5 dollars.
Bitcoin looking weak. Several bearish signals: - 4H Bearish divergence on the RSI - Rising Wedge pattern - Bearish breaker I have outlined a possible short term scenario.
SXP bounced from support. Watch that diagonal trend line. If it breaks, huge potential to hit 0.5 fibonacci.
VET is looking good. Some nice confluence: - Bullish divergence - Falling Wedge pattern - Support on former equal highs - Support on EMA200
On 4h timeframe we see a very clear falling wedge pattern on the chart. Also nice confluence with 4h demand zone. Price should bounce from here. If falling wedge pattern seems legit (we break the pattern to the upside) we shall make a new higher high.
Price currently at 0.618 fibonacci retracement. If the support doesn't hold here I expect a deeper drop in price to the 6h demand zone + 0.786 fib retracement. If we don't see a bounce from here, the price will drop even further and we will make a new lower low.
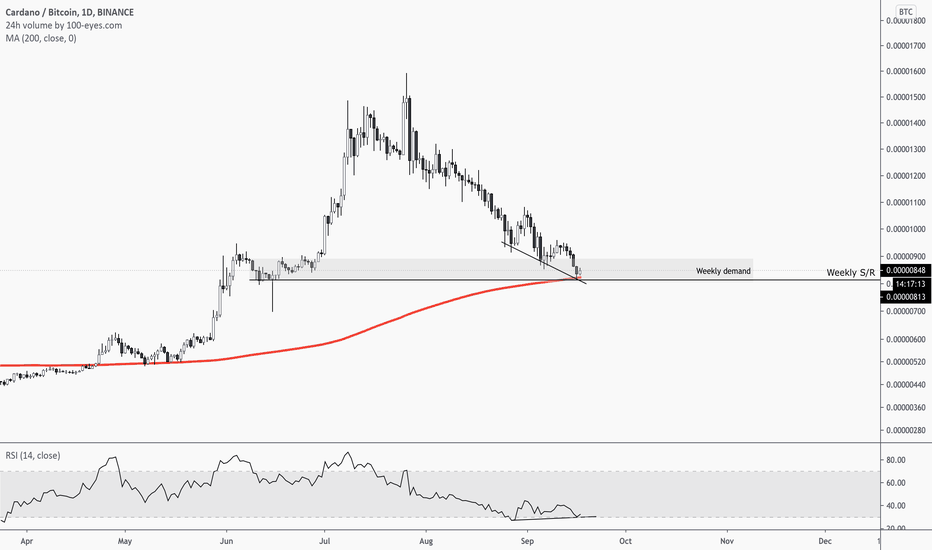
This had caught my interest. Price is currently on important support. From here the the bullish trend should continue, so what we want to see is a bounce from this level. -bullish divergence on the RSI on 1D timeframe. - MA200 support - Weekly S/R - Weekly demand zone But.... If we break this level to the downside and close the price below on high timeframe,...
This had caught my interest. Price is currently on important support. We see also a bullish divergence on the RSI 1D timeframe. But... If we break this level and close the price below on 1D/1W timeframe, we will retrace a lot further.


