FxPipMaster_TebohoMatla
NQ for the day i believe we bearish and might maybe try to fill yestersday's opening gap but for a more realistic outcome we can look for the midpoint of the volume imbalance as a possible exit and maybe even the bottom red horizontal line with is the low of the gap. 1hour TF we have a shift in structure lower and price is currently on the OTE levels
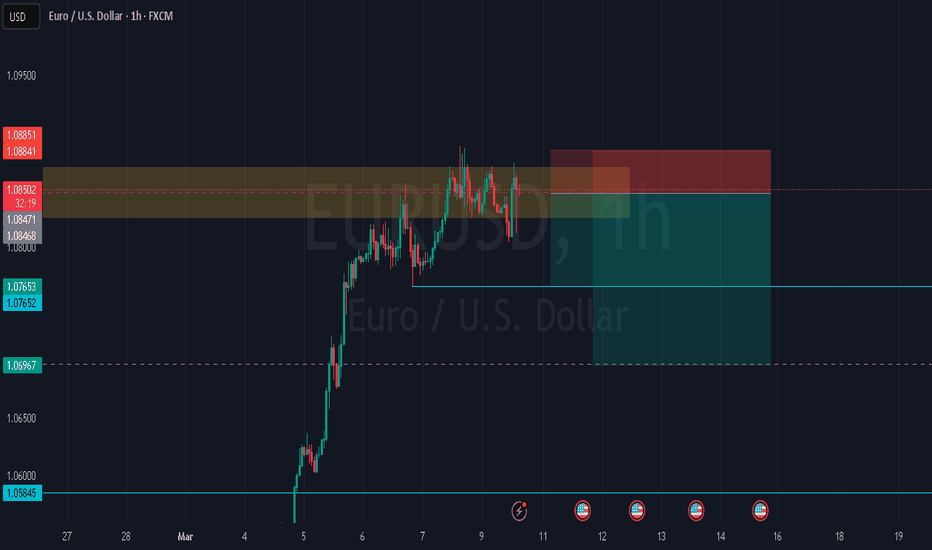
Good day once again traders EurUsd is looking very clear and clean if you ask me, now here what we see is that price is now trading inside a bullish order block after price broke the overall structure bearish but from experience I believe we all know that price does not deliver price one side so meaning price has to go fill imbalances left behind in the leg that...
Good day traders, today we just confirming the weekly bias on GBPAUD(sell) On the 4 hour TF we saw yesterday the market opened with a jump lower creating a volume imbalance which later we saw price revisiting those levels and for the most part of the day, price was trading around the VI and closed the day below the VI. For today we expecting price to close the...
Good day traders, we back with GBPAUD here we have a beautiful setup we looking to take advantage of. On the 4 hour timeframe we can see a clear volume imbalance and price is currently trading around it, as long price continues closing below the midpoint of that VI than we have a strong bias lower. On the 15 timeframes we can clearly see how price re balance the...
On this respective 15 minutes timeframe we can see the rectangle that represents our order block as ICT describes it low, high and lower lower with a FVG to support it Yesterday I posted this set up
Good evening traders Here we have an hourly chart with some lines that I’ll try to explain, in this set up the ‘WHY’ is the bullish breaker we wanna see the market revisit and I have marked the breaker with a white rectangle and overlapping that rectangle we have two blue line which represents our SIBI/FVG and with this FVG we would really appreciate it if price...
Lower timeframes 1 and 3 minutes we have structure shifts lower giving us a possible pullback setup on the hourly timeframe Keep in mind we bullish higher timeframes
Good morning traders I’m back with another Bitcoin setup, yesterday I did share an idea on Bitcoin which worked up perfectly and now we can confirm we’ve broken structure higher and the smaller timeframes have completed the pullback on the higher timeframes
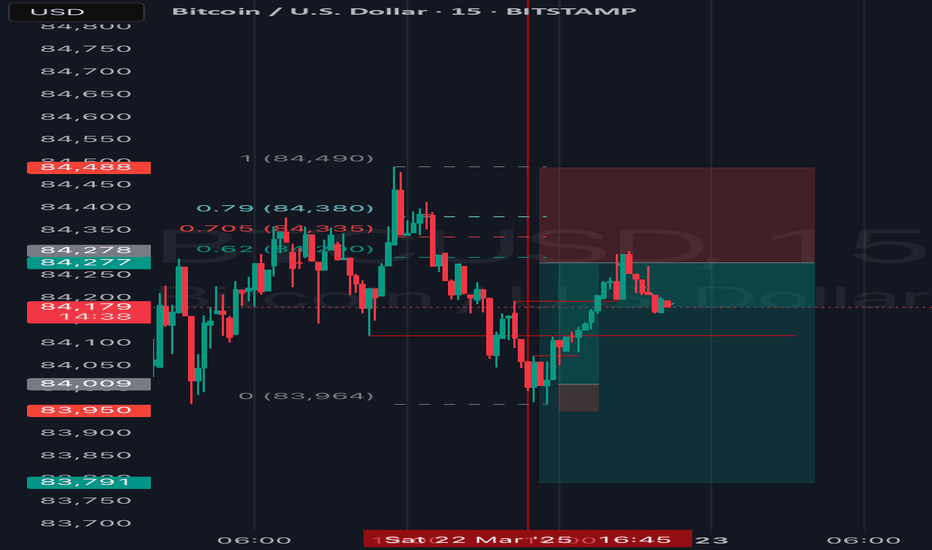
This idea is only for short term purposes only, the timeframe used is the 15 minute which broke structure lower and the three point represent the fib levels that ICT explains well on his teaching that we can use as our turning point or entry levels
Good morning traders USD/CAD for the London session we expecting to see price deliver lower to take out yesterday’s low marked sellside liquidity. Good luck
Looking at Gold on this hourly timeframe we can see that price just took out buyside liquidity and the reason behind that is we've been watching price create relative equal highs, now that liquidity is taken we wanna see price start moving lower and shifting structure bearish on the lower timeframes to start syncing with the hourly structure which is very much bearish
Firstly I would like you to put your focus on the greenish rectangle which in this case represents the daily fair value gap(SIBI), for the past 2 days price has failed to close above the midpoint of the daily SIBI indicating that price is setting up to deliver price lower as confluence the Dxy as provided a break higher, now moving to our hourly chart we can see a...
Starting on the smaller timeframes, 15 minutes we had a shift in structure higher and we currently watching price reprice the 15 minute fir value gap marked with the blue horizontal lines. one hour BISI(fair value gap) the purple lines should be used as exit points.
Using the drop-down method starting on the daily TF we had order flow and structure breaks higher with that been said our daily TF we are bullish and can start buying the dips. 4hour TF as shown on the chart above we can see price breaking structure/ or shifting structure high, the three horizontal lines(dotted) represent our OTE and as we can see the OTE and the...
AUD/CAD looking at this hourly timeframe we can see clearly the market has taken the downside liquidity and we can see that on the upside we have equal highs(Liquidity). On the higher TF like the daily timeframe we have a market structure shift higher, which confirms our daily structure to be bullish and the whole setup is confirmed by the 15 minutes timeframe...
Good evening Investors and traders, coinbase has formed a reveral pattern (double bottom) on the support level this is a straight forward double bottom formation. Use the Fibo levels as exits points Risk wisely!!
Good day traders, a friend of mine asked me to do some analysis on ETHUSD, and this is what I came out with, firstly I looked for any chart patterns which lead me to that bearish flag and this pattern is a continuation pattern. The market respected the pattern and retracted below till price reacted the next important level. Secondly we can clearly see that price...
This pair has been trading above the support with all the attempts to break the support failing since December 2020, this time the break below might be strong considering that on the daily chart we have a bearish divergence between price and RSI which is an indication that buyers are losing control to sellers, for confirmation wait for price to break below the red...


