Gargamel6500
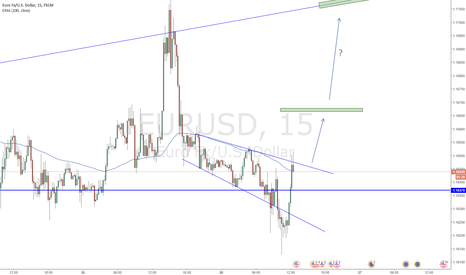
Breakout and retest. Good opportunity to look for long trades / trend continuation trades in lower time frames. Or just/ in addition trade the big formation from here.
Short term trend continuation setup 5 min chart. Retest of 100 EMA in 5 min chart, waiting for a break of the trend line.
Looking for a breakout of the megaphone pattern and a retest, but not sure where that will happen, could be just at trend line or 100 EMA in 15 min chart (preferably). Also possible consolidation in bigger chart, but am cautious because of news later today, therefore will just look for a short term trade ( Megaphone ).
Trend continuation trade setup. Brake and close above trend line.
Not a very clean cup, but price is above all 100 EMAs and has resetested multiple EMAs with a momentum push upward.
Head and shoulders Pattern has formed. Pay attention to 1oo EMA in 15 min chart. Target either hight of formation or EMA in 30 min chart.
Brief respite and retest of 100 EMA in 15 min chart. wait for break and close above trend line.
Wedge+Breakout as trend continuation trade retesting the 100 EMA in 5 min chart, looking for a denial at EMA to go short
Double top and breakout, wedge seems to be setting up in 5-15 min chart, waiting for breakout probably to upside to initiate retest of double top. Will wait for retest of 100 EMA in 4h chart to go short, should no retest occur-> watch out for trend continuation trades in lower time frames.
Consolidation, managed to get above 100 EMA in 15-1h chart . Waiting for a small move higher to get in.
Waiting for break and close above trend line. Retest of 100 EMA in 5 min chart.
Breakout of bigger wedge pattern waiting for a retest of 100 EMA in 1h or 4 h chart. Short term: wedge pattern in 15 -30 min chart-> short term trend reversal to start retest of bigger wedge.
Double Bottom: Price consolidated at resistance of DB, broke out. Trend continuation setup, waiting for break of trend line in 5 min chart.
Trend continuation setup after wedge pattern breakout.
Descending channel/Megaphone Breakout and retest of EMA. Trend continuation Setup= Retest of channel, Break of trend line
Consolidation + Retest of 100 EMA in 15 min chart + break of support Targeting green areas.
Head and shoulders pattern + breakout. After consolidating for a while, price managed to hold above the 100 EMA in 30 min and 1h chart, + price seems to have retested at the EMA in 1h chart and currently sits at EMA in 15 min chart. Will enter if price manages to get above EMA in 5 min chart.
Seems like a triangle is setting up, waiting for a break of the 30 min 100 EMA, targeting old support or 4 h EMA.


