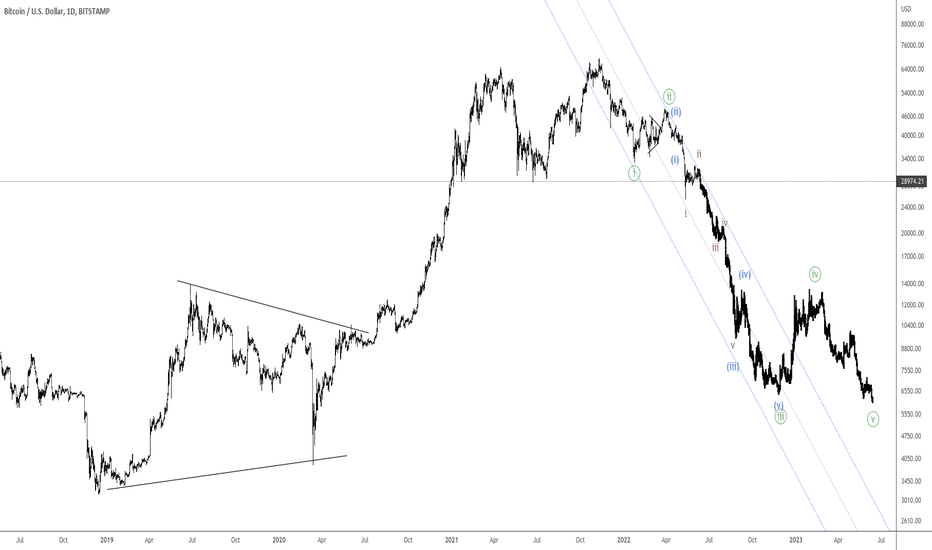
Looks like the termination of wave ii corrective rally is here. Good to start scaling in your shorts here for ES since the probability of going down is increasingly high. Critical levels marked. Historic lows in 3 months incoming
Price is at optimal trade entry zone Divergence forming at resistance area Expanding diagonal wave 4 completed Extended wave 5 of the Expanding diagonal pending Dump next week coinciding with several possible black swan events(china invasion?) PUTS PUTS PUTS
Annotations in the chart. Expecting price to move sideways and down until the end of August in which will probably coincide with the invasion of taiwan Bear market rally will follow in the form of wave C of IV . Rally will look impulsive to trap usual retail fomo traders and WSB degenerates.. Then big NUKE by Oct- November
Price collapse and <$1000 BTC by the next two years with 99.9% certainty
Dont underestimate how bearish this ponzi can become no support until 7-9k USD Cheers
PA is quite similar to late feb- mid march triangle/ crab price action possibly seeing wave (x) forming here for bitcoin Long mid and low 29k TP 34.5k 35k usd SL below wave (a)
Title is explanatory will follow other coins that dumped just lagging a bit
Banks trying to let you sell your bitcorns cheaper so they can accumulate LETS GO
Similar to other small caps like BEL OGN before the big pamp Load your bags here and sell at the GOD CANDLE
Looking at this trade right now Long at current levels SL swing long TP 40k-41k USDT
Long HEre or above 0.00922 TP purple lines :) SL very conservative
This is a bear market rally The FED will dump all the ponzi's that they pumped with printed dollars On the hit list TESLA NQ DJI NVDA Short it all with FURY New lows incoming Gonna be a bloody memorial day
Invalidation below 28 k confirmation above 30k Cheers
UP only . exe for this coin after nearly 5 years of crab price action Ghost candles derived from bitcoin price action Q4 2020
Don't go against the FED Run while you can. Keep your money in the banks, don't even think about investing, that decade is over FED going to keep nuking until we reach the turquoise level
Title is self explanatory Conservative stop at the red horizontal targets marked
Looks like the bigger ABC decline has terminated in what appears to be an ending diagonal. If this is the case we could see resumption of growth Confirmation above prior wave (iv)
This is just the worse possible case for Bitcoin Likelihood for prices to reach $4000 $3600 USD per Chinese Bitcoin is high as FeD continues to pull out approx 1.1 million United states dollar per minute In September they will ramp it up to 2.2 million USD per minute Imajin all the sell pressure from the FED lots of FUNDS going to blow up big time Michael...


