GiancarloZacc
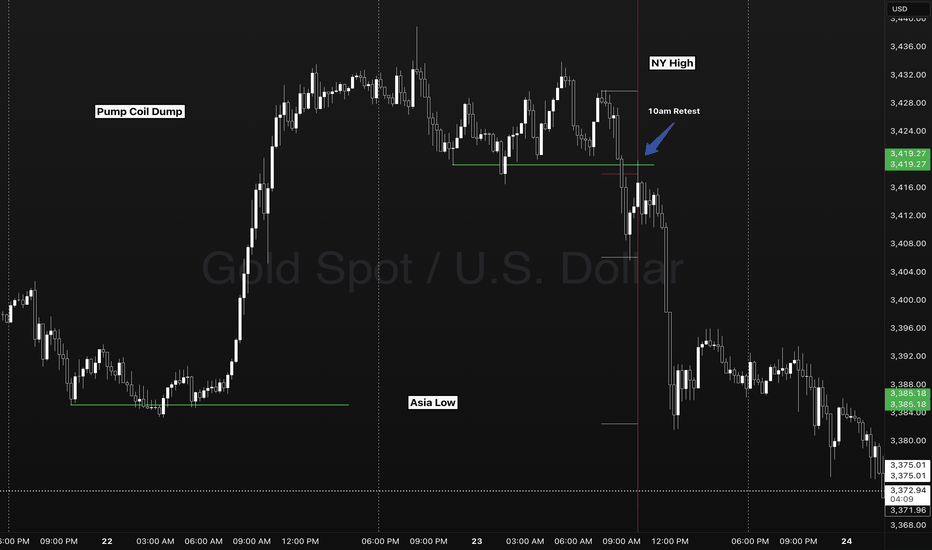
EssentialIn this example we see FOREXCOM:XAUUSD forming a simple and scalable setup interacting with key session levels and key times of day. - 4HR OPEN CLOSE (10:00am) - SESSION TIME RANGES - DAILY HIGH/LOW - SESSION HIGH/LOW Here on my chart I use no lagging indicators. A previous session ranges high and low represents the major liquidity levels. A classic break and...
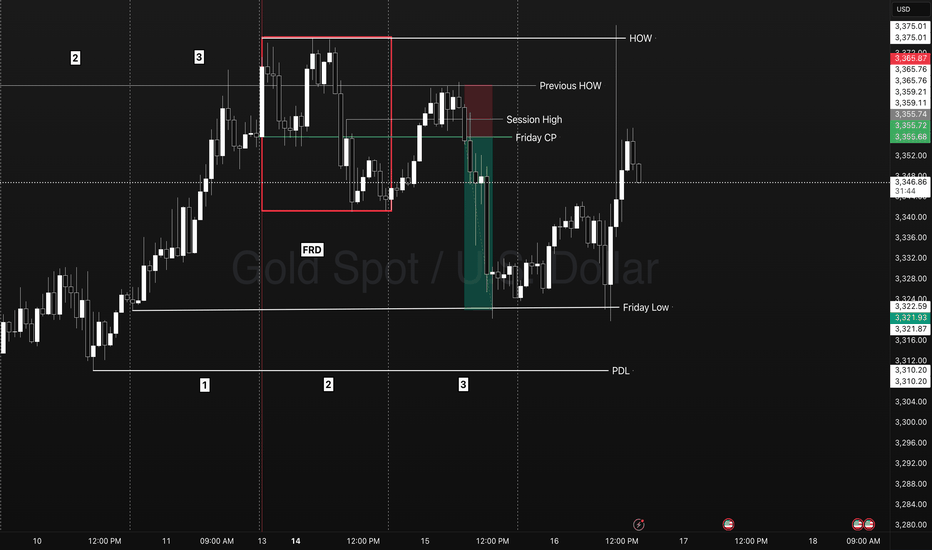
Identify what signal a market is showing you. TYPES IOF SIGNAL DAYS - First red/green day - Dump/Pump - Inside day Frame the Trade play - Reversal - Continuation Identify the Levels - HOW/LOW - Session High/LOW - Friday Closing Price. Trade Explanation On the previous week FOREXCOM:XAUUSD triggered 3 days of breakout traders into the market closing in...
- Previous day high/Low - Weekly high/low - Session high/low - Closing Price In this specific example on OANDA:AUDUSD we have a day 3 Tuesday breakout fail reversal setup on the backside of a previous weeks expansion. Fridays closing price was plotted going into Monday day 2 on the backside of a new week. Once the initial high low was set on day 2 below the...
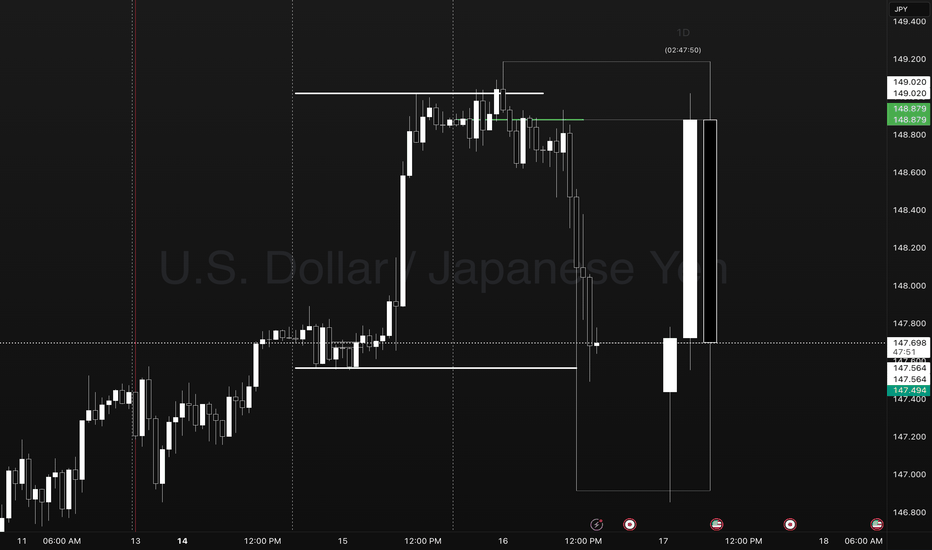
USDJPY Reversal Trade. Points to Notice Day 1 - Sets the new week high and low. Establishes a new week closing price as a target for a day 3 setup. Day 2 - Typically expands Mondays range in the direction of the underlying oder flow. This occurs as a pump/ dump leading to the Asia and London coil sideways. Day 3- We take note of the previous day high and low to...
15-Minute Price Action Breakdown | Liquidity Sweep Into HTF FVG and CISD Model The 15-minute chart illustrates a precise example of liquidity engineering and reversal within the framework of a higher timeframe draw on liquidity. Here's a breakdown of what occurred: --- Contextual Framework Price was clearly drawn toward a high time frame imbalance zone,...
Trading SPY, QQQ, or its futures counterparts had people checking their swing trades! A previous pivot point near the 0.382 level showed an area of piled up stop loss orders. With a glimpse of all time highs early in the morning a new measurement was required at the over night swing level. Price took the elevator down to grab the liquidity before moving higher?...
This chart shows how cycle lines can be used to estimate potential short term trade opportunities in the crypto market. The key is to identify what price action is doing in order to pick an strategy that works for your trading style. Instead of quantifying directional based biases, measure time, cycle lengths, price ranges, and more. Many traders know what the...
Gold has entered full acceleration mode, displaying a textbook parabolic move following the recent FOMC-induced volatility. After an initial shakeout that saw weak hands liquidated, price has rebounded with unrelenting bullish momentum, carving out higher highs with surgical precision. This parabolic curve reflects strong institutional demand, as each shallow dip...
NYSE:DELL Scanning through the market today I found some good looking price action in the tech sector. Dell Computers along SMCI ,TSLA, and PLTR where also some big movers today. I look for what price action is the most clean for entry and exit points. Yes, other stocks may have returned more than Dell Computers today. However according to this chart, some...
NASDAQ:AMD This poor company has been caught in a Daily downtrend for months now! Currently we are approaching some areas I believe may be key. The 125.00 round number acted as a key area of resistance on multiple occasions. Using Fibs from the most recent leg down I was able to project a 2 deviation projection from the balance point at 0.50. This balance area...
TVC:VIX Can Volatility cycles be estimated using the VIX chart? I tend to look for information that shows time based confluence. How do you use the VIX for your trading style? Comment down below!
NYSE:VST Late night charting session doing what I do best. 2:55am
In a trending market breakouts and pullbacks occur. Using Gann Boxs and Fib levels with volume and moving averages seem to be very accurate. Time to make a plan to execute on this idea consistently.
I have found that Fibb Numbers can be highly effective and does not lag like an indicator. These numbers can be used to visually validate pullback and bounce zones, predict the closing price, validate a healthy trend, and show areas to take profit. using these numbers will allow the trader to visually understand how price may move. It is key to wait to validation...


