GoldMasterTrades
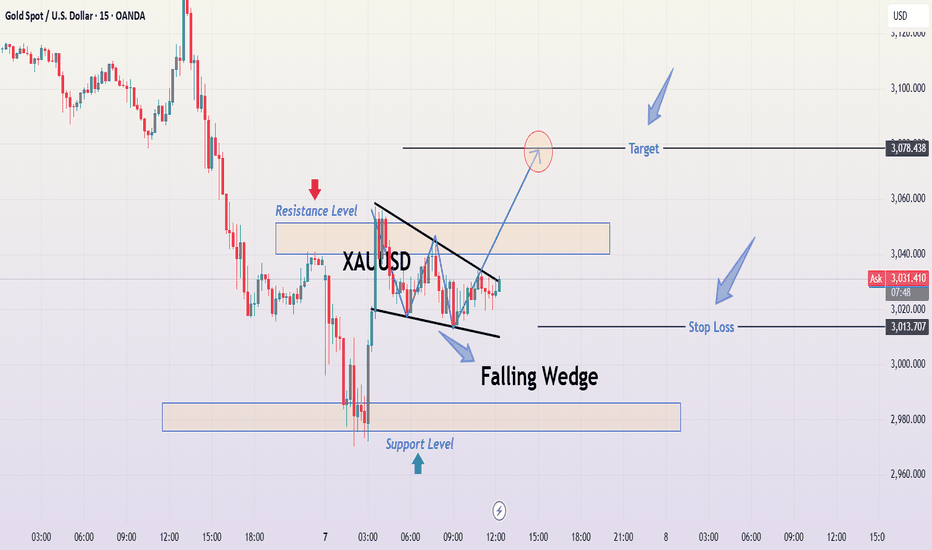
📐 2. Technical Pattern – Falling Wedge A falling wedge forms when the price consolidates between two converging downward-sloping trendlines. It suggests diminishing selling pressure and a likely reversal. Key Characteristics in This Chart: Upper Resistance Trendline: Formed by connecting the series of lower highs. Lower Support Trendline: Formed by connecting...
🔍 1. Market Context & Structure Gold has recently experienced a sharp decline, as evident from the aggressive bearish candles leading into the consolidation phase. Following this downward momentum, the market began to consolidate, forming a Falling Wedge pattern—a bullish reversal structure that often signals an impending upside breakout, especially after a...
🔍 Chart Overview: EUR/JPY – Daily Timeframe This chart illustrates the price action of the Euro against the Japanese Yen and highlights a Falling Wedge Pattern developing over several months. This is a classic bullish continuation/reversal setup, supported by key technical levels. 📐 1. Chart Pattern: Falling Wedge A falling wedge is a bullish chart pattern...
Overview of the Chart This chart displays a EUR/GBP daily timeframe setup, highlighting a Double Bottom Pattern, a well-known bullish reversal formation. The pattern consists of two consecutive lows at a similar price level, followed by a breakout above a key resistance zone. This setup suggests a potential trend reversal from bearish to bullish. Technical...
🏗️ 1. Pattern Structure Breakdown 🔵 Cup Formation: The left side of the chart illustrates a steep decline beginning around mid-October 2024, forming the left lip of the cup. The bottom of the cup was established between late December 2024 and early February 2025, where the market found a strong support level near 1.0220. A rounded bottom formed, which indicates...
🔍 Full Technical Analysis of JPY/USD (Daily Timeframe) 🧭 Overview The chart shows a sophisticated price structure unfolding over several months. A falling wedge reversal pattern formed during a sustained downtrend, which later transitioned into a bullish breakout and continuation. This analysis provides insights into market behavior, price psychology, and a...
🧱 Chart Pattern Identified: Double Top Formation The chart displays a classic Double Top pattern, a bearish reversal structure typically found at the end of an uptrend. This pattern forms when price reaches a resistance level twice, fails to break above it both times, and eventually breaks the neckline/support level, confirming a shift in market sentiment. 🔍...
🔍 Overview The chart displays a classic Cup and Handle pattern on the weekly timeframe, a well-established bullish continuation formation often found in long-term uptrends. This pattern, combined with major technical confluences such as trendline support and strong horizontal levels, provides a high-conviction long setup with defined risk and reward. ☕ 1. The...
📊 Overview: This 4-hour chart of Gold Spot (XAU/USD) presents a clean bullish pennant breakout followed by a corrective pullback to key support, offering a high-probability trading setup for bullish continuation traders. Gold recently surged above the psychological $3,000 level, but after testing the previous resistance zone / ATH, it retraced back into a...
1. Overview of Market Structure The EUR/GBP pair is forming a Rising Wedge Pattern, a well-known bearish reversal formation, which suggests that the current uptrend may soon reverse into a downtrend. The price has been moving within a tightening range, making higher highs and higher lows, but the upward momentum appears to be weakening. A breakdown from this...
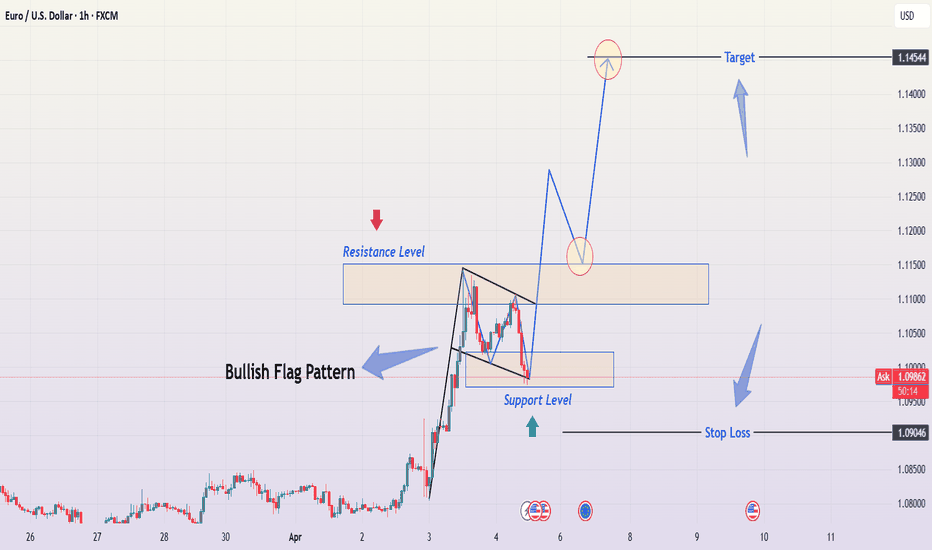
Technical Analysis & Trade Plan for TradingView Idea This chart illustrates a Bullish Flag Pattern on the EUR/USD 1-hour timeframe, suggesting a potential continuation of the prevailing uptrend. Below is a detailed breakdown of the market structure, key levels, and a professional trading strategy. 📌 Chart Pattern: Bullish Flag Formation The Bullish Flag is a...
1. Market Structure & Technical Pattern: The Japanese Yen (JPY) against the U.S. Dollar (USD) has been exhibiting a clear Rising Wedge Pattern over the past few months. This is a classic bearish reversal pattern, indicating that buying momentum is gradually weakening, and a strong decline is likely to follow. Formation of the Rising Wedge: The price has been...
The chart represents a technical analysis of Silver (XAG/USD) on the daily timeframe (1D). A Double Top pattern, one of the most reliable bearish reversal formations, is developing. This signals a potential downtrend, with key price levels and trendlines confirming weakness in bullish momentum. Below is a full breakdown of the pattern, price action, and trading...
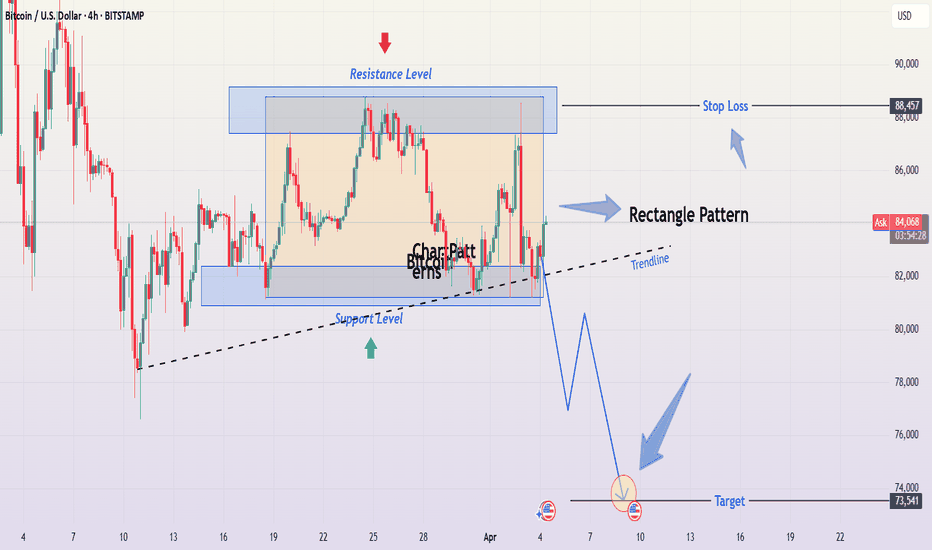
Bitcoin (BTC/USD) 4H Chart – Detailed Professional Analysis This chart presents a Rectangle Pattern, a common consolidation structure in technical analysis. The price has been oscillating between a well-defined resistance level near $88,000 - $89,000 and a support level around $80,000 - $81,000. This pattern suggests an upcoming breakout, with bearish...
1. Chart Overview The 15-minute XAU/USD chart shows a descending wedge pattern forming after a price rally. The wedge is characterized by a series of lower highs and lower lows, signaling a gradual weakening of bullish momentum. After consolidating within this wedge, the price has broken down, suggesting a bearish continuation. This setup provides a...
Professional Analysis of the EUR/GBP Chart This EUR/GBP (Euro/British Pound) daily chart from OANDA, published on April 3, 2025, highlights a key technical setup based on price action analysis, chart patterns, and support/resistance levels. 1. Market Context: Accumulation & Transition to a Triangle Pattern Curve Zone Formation (Rounded Bottom): The market...
Overview of the Chart: The chart represents the EUR/USD (Euro to U.S. Dollar) pair on a 1-hour timeframe, showcasing a bullish ascending triangle breakout. The pattern indicates an upward continuation in the trend after a period of consolidation. This analysis will break down the key elements of the chart, the technical structure, and the potential trading...
This chart represents the JPY/USD (Japanese Yen vs. US Dollar) on a daily timeframe (1D), published on April 3, 2025, via TradingView. The price action and technical indicators suggest a bearish outlook based on the formation of a Rising Wedge Pattern, a classic reversal structure signaling potential price depreciation. 1. Chart Structure & Identified Patterns ...


