Gold_Free_Signals
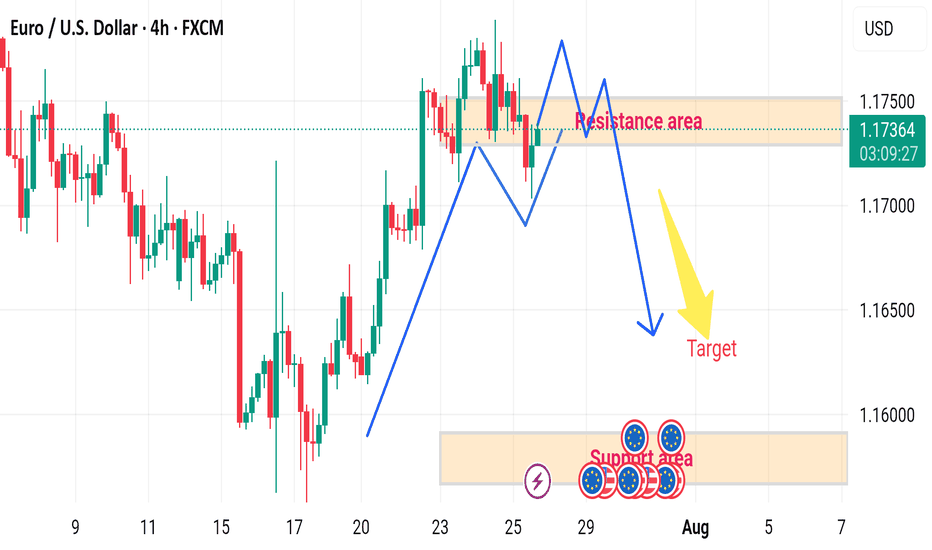
🔄 Disrupted EUR/USD 4H Analysis 🟢 Current Context: Price is currently at 1.17375, slightly below the resistance area (1.17400–1.17500). Market shows a recent bullish impulse, followed by consolidation within the marked resistance zone. Projection in the image suggests a double-top pattern forming at resistance, followed by a bearish reversal toward the target...
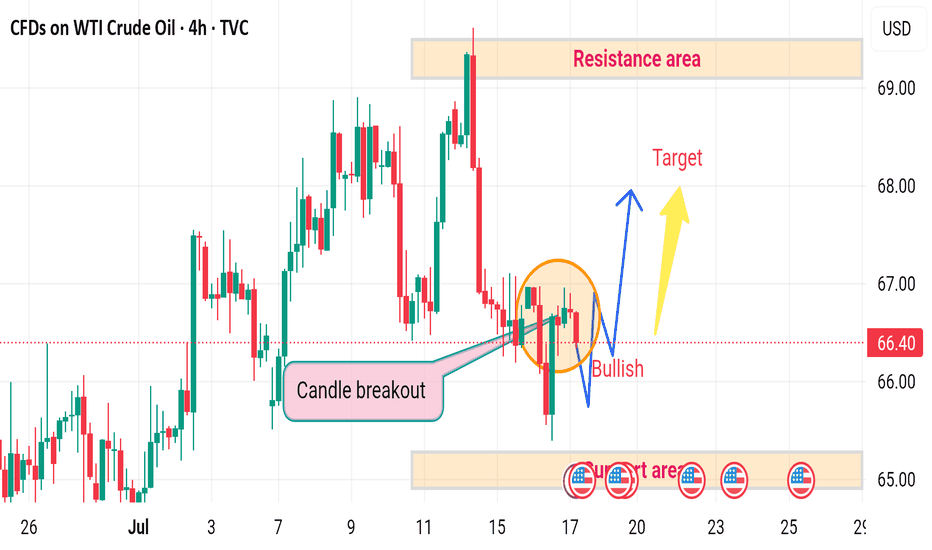
⚠️ Disrupted Analysis – WTI Crude Oil (4H Chart) 🔻 Bearish Pressure Re-Entering Despite a temporary candle breakout, the price failed to sustain above the breakout trendline. The recent price action inside the orange circle shows lower highs and rejection wicks, indicating bullish weakness. 📉 Potential Breakdown Risk If the price fails to hold above 66.00,...
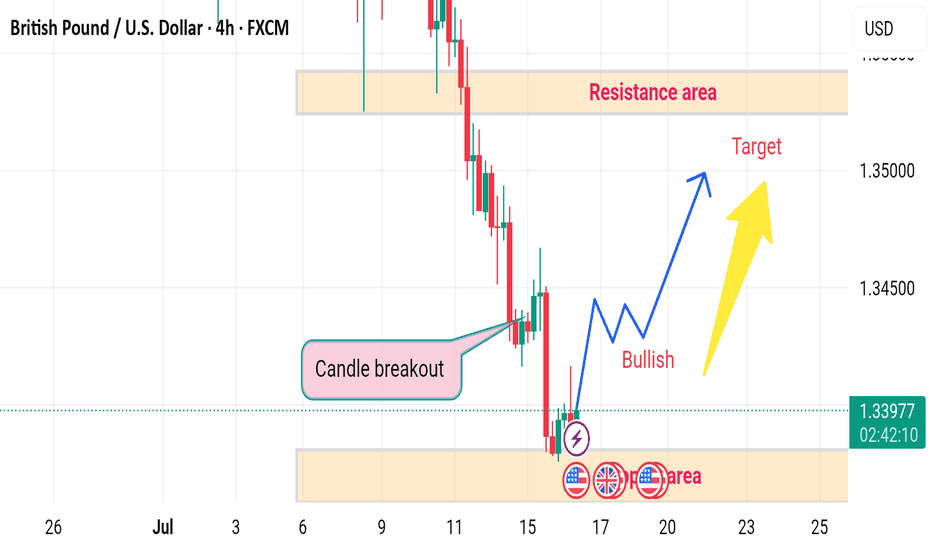
Disruption Analysis – GBP/USD (4H) 🕯️ Candle Breakout Misleading The marked “Candle Breakout” area is followed by weak bullish momentum, but lacks strong volume confirmation or higher timeframe reversal structure. The quick rejection after the breakout may indicate a false breakout, not a sustainable trend reversal. ⚠️ Demand Zone Weakness The “Support Area”...
🔄 Disrupted EUR/USD Analysis (4H) 📉 Current Structure: Price is hovering around 1.17298, showing hesitation at the resistance of a potential bearish flag. While the chart labels this zone as “bullish,” there are signs of market indecision, possibly a fakeout trap. ⚠️ Key Disruptions: 1. Bullish Trap Risk: The price formed a short-term M-pattern (double top...
⚠️ Disrupted Market Perspective 🟩 False Resistance Zone The marked resistance area (~109,000) has been breached multiple times with high volatility, suggesting weak resistance strength. Instead of rejecting price, this zone acts more like a liquidity trap — luring in sellers before price spikes higher. Expect fake-outs or bullish traps near this area. 🟨...
Resistance Reversal Zone: 145.80–146.20 (watch for break or rejection). Support Trap Area: 143.80–144.20 (possible fakeout and rally). Breakout Confirmation: Sustained candle close above 146.30.
🔄 Disruption Analysis: 📌 Current Scenario: Price is trading around 3,336.400, just below the identified resistance zone (~3,340-3,343). A range-bound structure is visible with repeated rejections at resistance and support. --- 🚨 Disruption View: ❌ Invalidating Bearish Bias: The chart assumes a bearish move toward the 3,320 target, but there are early...
⚠️ Disruption Analysis – Gold (1H): 🔹 Pattern Disruption Identified: The chart previously followed a descending structure with lower highs and lower lows, confirming bearish momentum. However, a temporary recovery (small bullish correction) appears after a sharp drop, disrupting the previous flow. --- 🔄 Disruption Points: 1. Break in Momentum (Structure...
❗ Disrupted Market Outlook: ⚠️ False Breakout Risk: The recent "Breakout" above previous highs may be a bull trap. Although price surged, the follow-up candles are showing lower highs, suggesting weakening bullish momentum. 📉 Bearish Divergence (not shown but likely): Based on the price action, there's a potential bearish divergence with RSI/MACD (if...
🔀 Disruption Analysis – Bullish Alternative Scenario The current chart suggests a bearish outlook from the resistance zone (~$2,495–$2,500), targeting a drop below $2,425. However, here’s how a bullish disruption could break this bearish narrative: --- 🟢 Bullish Disruption Possibility: 1. Support Reclaim & Strong Buyer Reaction: If price reclaims and holds...
🔀 Disruption Analysis – Bearish Alternative Scenario The current chart suggests a bullish continuation from the consolidation zone around $107,300–$107,500, with a projected move toward $108,500+. However, the following bearish disruption could invalidate that path: --- 🔻 Bearish Disruption Possibility: 1. False Breakout Trap: If price briefly spikes above...
🔀 Disruption Analysis – Bearish Alternative Scenario While the current setup points to a bullish continuation above the support zone (around 144.10–144.20) with a projected target near 144.60, here’s how a bearish disruption could unfold instead: --- 🔻 Bearish Disruption Possibility: 1. Failed Breakout / Bull Trap: Price may fake a move upward to trap...
🔀 Disruption Analysis – Bullish Alternative Scenario While the current chart outlines a bearish scenario after a short-term bullish correction, leading to a drop toward the target near 1.36600, here’s how a bullish disruption could unfold instead: --- 🟢 Bullish Disruption Possibility: 1. False Breakdown / Bear Trap: The market may dip slightly below recent...
Disruption Analysis – Bullish Alternative Scenario While the current chart suggests a bearish setup from a resistance zone (around 1.1765) toward a target near 1.1630, here's a potential bullish disruption that could invalidate the bearish thesis: --- 🟢 Bullish Disruption Possibility: 1. False Breakdown / Liquidity Grab: Price may fake a dip below the red...
🔀 Disruption Analysis - Alternative Scenario While the current chart suggests a bullish breakout from the support area around $35.85–$35.90 with an upward target above $36.20, a potential bearish disruption scenario could unfold under the following conditions: ⚠️ Bearish Disruption Possibility: 1. Weakening Buying Pressure: Price has tested the support zone...
📉 Gold Price Disruption Analysis – 1H Chart Current Price: $3,282.880 Timeframe: 1-Hour Trend Direction: Bearish bias with possible continuation toward $3,250 --- 🔻 Bearish Scenario (Planned Path): Support Turned Resistance: The area around $3,290 acted as strong resistance (previous support). Price failed to break above. Lower High Formation: Price has...
🔄 Disruption Analysis: Contrarian View ⚠️ Original Viewpoint Summary: The original analysis suggests a bearish breakdown from the rising channel, with a short-term target of 64.36, pointing to a move towards the support zone. --- 📉 Disrupted (Contrarian) Perspective: 🔁 Fakeout Scenario Possibility: The sharp drop below the trendline may be a bear...
🟥 Disrupted (Bearish or Cautious) Analysis: 1. Failed Bullish Attempt Risk While a bounce from the support zone (~3,260 USD) is visible, the momentum lacks strong bullish confirmation. The rejection from the support area could be a dead-cat bounce, especially since the overall trend leading into this zone was sharply downward. 2. Volume Divergence The volume...


