Gor_Union
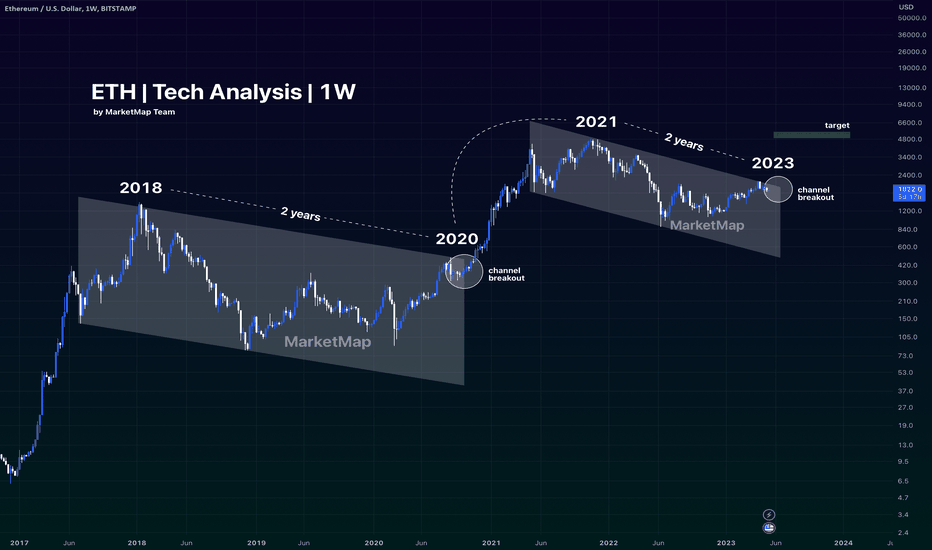
PremiumHistorically, we see this kind of structure often. Technically, it is simply a price movement within a range for the purpose of accumulation and / or distribution. Many of you may think that technical analysis does not work or works poorly. No. It works great if you actually know what technical analysis is. Even the popular Smart Money approach is the same...
Analytics provides a clear understanding of the market. Technical analysis works if applied according to the present rules. Many traders do not know technical analysis, do not understand its essence, and do not use large timeframes. The main problem is a lack of quality knowledge and a great desire to act. After studying my chart you will understand what to...
Just as planned (Update on my previous idea) Hope you guys get my recommendation. Half of the trade is closed
Have an uptrend structure at ZIL, waiting for the reaction from the FVG or OB zones
If you were short with me, congratulations (Update on my previos EOS idea)
SOl Looks bearish, finaly got to the OB, waiting for the bearish move till bottom OB!
Looks bearish to me, price is being pushed down by a resistance, but there could be a little upward reaction to take off the bears :D
Addition to yesterday's idea on EOS, seems not so cheerful reaction as bitcoin, keeps in the area of the wedge, so far it seems to be calm and clear.
Falling wedge breakout, but looking at chart i think the job at the top is done so waiting in the selected zones
Rising wedge at EOS 12h chart. Expect the downward movement till 0,5 OB and bounce from that zone.
What do you think about BTC right now? I personally can see only one option. It will have a little trade in the zones, but preferably will go till second FVG zone
Looks like it want to go up a little bit, just a simple ascending triangle, nothing more. Is someone still trading it?
Have a rectangle technical analysis pattern + ascending triangle. Planing to open long in case if price breaks the top line (resistance)
My view from smart money perspective at future price movement. Leave a comment if i missed something, I would really appreciate any cooperation
I am considering an asset for a medium-term spot trade. The asset looks strong. The only question is in the buy zone. A potential upside correction is seen from the current ones.
Only technical view on chart, without fundamental analysis. Like + comment! :)
There is only 274,391,591 tokens. So price of this asset can be more that $100+ easily in long-term.
The asset looks great from a growth perspective. Fundamental hasn't been studied. I am writing only about the Technical side of the chart. On the log chart I see the global trendline and the levels that will be "closed" during the potential growth. Agree? Please write you opinion below. Market Analysis Every Day!


