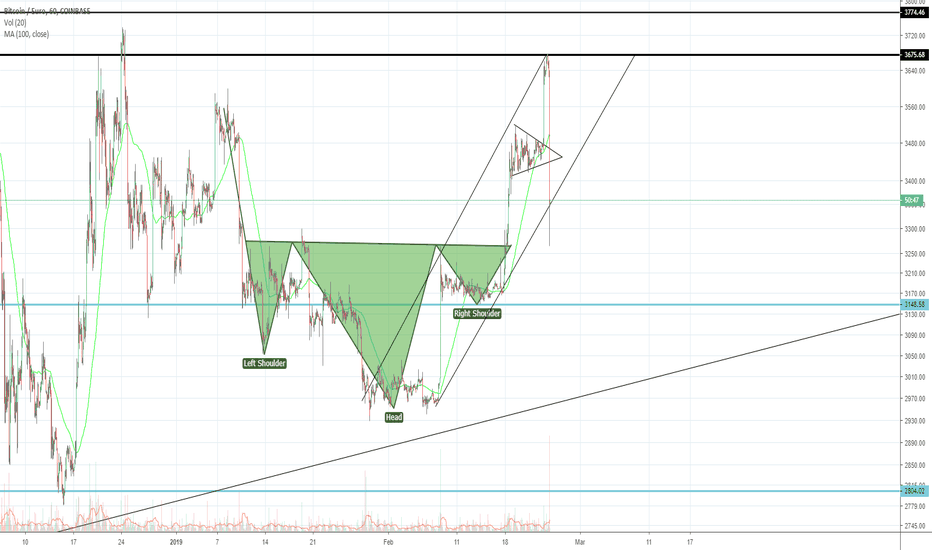
seems like a continuation triangle is beeing formed, me wight see a dump before we exit the pattern. Bullish bias.
A cup and handle patter seems to be forming in bitcoin. If the pattern confirms, price will drop to 8-7.9k levels and after this, a new upwards movement will start for bitcoin. This, combined to the macd indicator on weekly pattern beeing close to cros, and the breakout of the descending channel that was confirmed, presents a bullish bias in the market
Now that double bottom has been broken, the bias shifts to bullish. Probable surge till top channel resistance and then form an ascending triangle
Expect a drop in the next hours as the descending pennant keeps playing out. Pattern should be complete in mid december with bullish bias.
After the bull run that happened up to 26th June we have been consolidating in a downwards channel until 24th October's surge. We are now finishing a descending pennant pattern, that will be over by the end of 21st November. Bullish target is 9.5K while bearish target is 7.9K, with a slight bullish bias.
Bitcoin is trending in 5 phases, expected growth up to the top of the channel
The death cross on weekly chart and a slight bearish divergence shows us s bigger probability of breaking on the downside and retesting lower resistance zones. Expect a retrace till rsi reaches the 30 levels, for a double bounce, just like in previous bear market. Bearsih short term but bullish mid term
This pattern has been forming for almost 3 months, the 1st impulse wave represents the h&s price target
BTC is above important ema's and quietly breaking the line
Bitcoin still following the channel
BTC is continuing the movement to the top of the channel. Expect a bounce + fib pullback around the top levels, probably a good place to set a stop sell. Volume still too low to have a breakout of channel.
Possibly a wave 5 is forming in BTC, objective is ~9.9K
Triangle pattern in BTC almost over, seems like we could have an uptrend closely as we get near the apex


