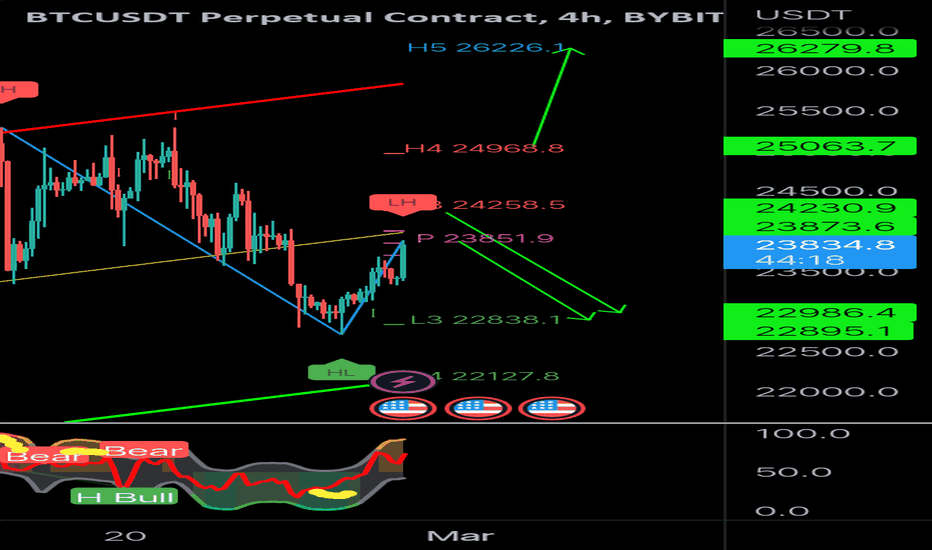
potential price action on chart. ranging yellow line more likely imo.
daily and weekly camarilla pivot points. some possibilities in the near term for where we might pop to and correct from or correct to.
daily and weekly camarilla pivots. points of interest where btc COULD correct to in near to mid term... unless it breaks away now
Something interesting to see. compare this month camarilla monthly pivots to last months. also look at the oscillation and divergences. Last month price opened in the middle, went to L3 with bear divergence and then went to H3. So far this month it is doing the exact same thing. What does it mean? it means I would not worry until that L4 is taken out for more...
These levels are important ones imo. It is possible we range between H3 and L3. beyond those we could get stabs to H4 or L4. But with daily closures or strong breaks of H4 or L4 I would look for continuation to H5 or L5 for range breakout targets. These are monthly camarilla pivot points. Right now btc is resting and making support out of the central pivot and...
likely ranging between H3 and L3. for more in either direction look for strong break of L4 or H4. These levels are valid untik daily close
levels and loctions to watch for possible reactions and desinations
two points of resistance Pivot and weekly H3. above weekly H4 I would look for new highs. but could have correction from these areas
More than likely ranging between L3 and CPR/H3. however in case of further breakout up or down watch L4 and H4
not looking good. here are levels to watch. really do not want to lose these levels we are currently under
pivot pointd for possible range for the week. potential range tops and bottoms between these levels H3 and L3 with possible breakouts beyond the 4th levels
will be keeping my eyes on these levels. may be some ranging between them
expect short term range likely bwtween L3 and H3. expect more upside with a break of H4. expect some downside with break of purple levels and L4. These are daily camarilla pivots. if the range stays true the next days range will change and be more narrow.
Here we have weekly and monthly camarilla pivots. I see this as a risky area for a long. Also a short. One one hand we could drop down to monthly L3 and pivot if this area does not hold. However it is weekly L3 but with both sides of weekly range being tested already... it could hold or break just as likely in my opinion. if it does hold and bounce I would look...
possible next moves, support, and resistance for bitcoin. We may see a push to H3 this week. or if not... or after... correction to L3.
looking at camarilla pivot points for the weekly and month we can find two possible places of resistance and correction IF bitcoin has another impulse following this FOMC. I figure weekly H3 or monthly H3. with monthly L3 and Pivot point being the potential next support.
orange arrows would be corrective move only. red would be breakdown of structure. green would be continuation. I see a corrective move more likely before a continuation.
possible resistance area here. watch this H3 level. tread carefully


