HEISENBERG_SayMyName
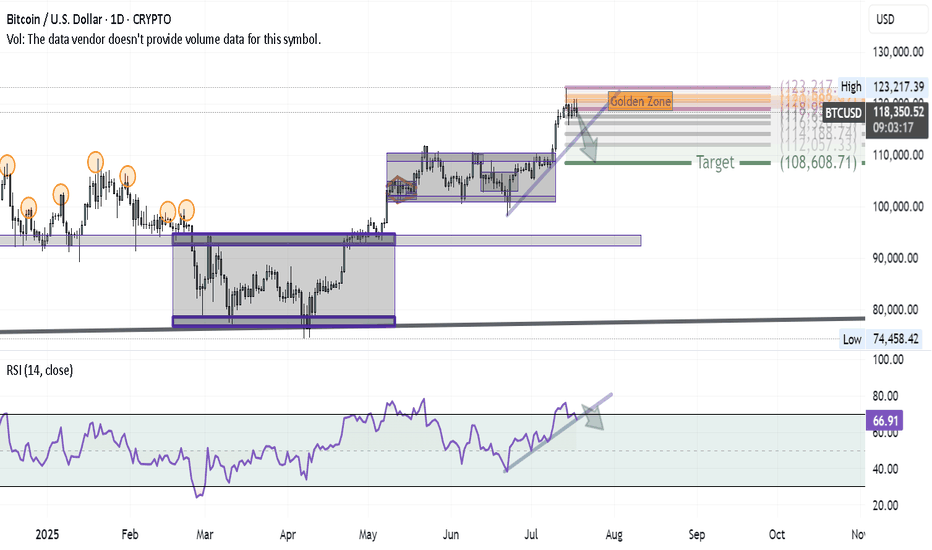
After successfully hitting the BITCOIN target and anticipating a major correction in my previous ideas, here’s how the first wave of that correction is shaping up on the daily chart: 1- At the recent high, a Shooting Star candle formed — a classic reversal signal. 2- Using Volunacci analysis, the price retraced exactly to the Golden Zone, validating the...
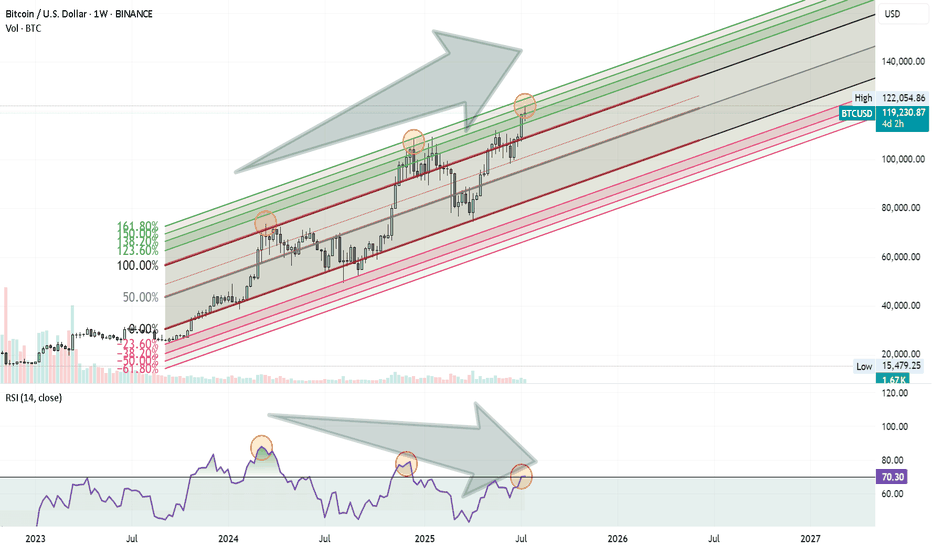
Bitcoin might be approaching a Turning Point . Here’s what I’m seeing on the weekly chart: Price is moving inside an ascending Fibonacci channel. It’s getting close to the 1.60 (160%) extension level, which has acted as a reversal zone before. At the same time, the RSI is showing a clear negative divergence, suggesting that momentum is weakening. ...
Inverted Head&Shouldres -- Breakout -- Double top -- Retest Neckline -- BOOM !!
In last week’s Bitcoin idea, I highlighted a key technical setup: price retested the neckline of a massive inverted Head & Shoulders pattern and launched a strong move upward. Let’s dive into what’s unfolding on the daily chart. We’re seeing classic Wyckoff consolidation behavior—appearing right before the breakout and again after the neckline retest. Multiple...
A rare and highly instructive market structure is currently unfolding, presenting a textbook case of Wyckoff pattern integration across multiple timeframes. Over the past weeks, I’ve been tracking a series of smaller Wyckoff accumulation and distribution patterns nested within a larger overarching Wyckoff structure. Each of these smaller formations has now...
On the monthly chart, NIKE has been in a downtrend since November 2021, but the signs are pointing toward a potential trend reversal. Here's why I believe the bottom may already be in: ✅ MACD Histogram shows a strong positive divergence, signaling weakening bearish momentum. ✅ The RSI downtrend line has been broken and successfully retested, confirming bullish...
On the monthly chart, Apple (AAPL) is steadily moving within a well-defined ascending Fibonacci channel, like climbing a ladder — step by step. The price is currently testing Step 4 , a zone that has acted as a strong resistance barrier. Despite the pressure here, the structure still appears bullish, and even a minor pullback might simply be a pause...
On the weekly timeframe, the EGX100 Equal Weight Index is showing a technically significant structure: 🔹 Touched the midline of the Fibonacci channel for the 9th time, after a confirmed breakout — this midline has acted as a dynamic support zone over time. 🔹 Also testing an ascending trendline for the 3rd time, adding strength to the current support...
We’ve seen it before—and we might be seeing it again . The Dow Jones is showing a familiar pattern, and here’s what’s happening: The index has been repeatedly hitting the 1.618 Fibonacci extension from previous ranges. Right now, we’re approaching the 100% extension between the last swing high (~45,000) and swing low (~36,600). If the Dow breaks...
📈 Dow Jones Weekly | Fibonacci Channel in Play Since 2020 The Dow Jones Industrial Average has been trending within a well-defined Fibonacci channel on the weekly timeframe since the 2020 lows. 🔹 The price has consistently respected the Fibonacci levels as tilted support and resistance lines—a technical behavior that adds weight to this structure. 🔹 Three major...
Silver has broken above a two-top downtrend with a strong bullish impulse, marked by a long white candle. Currently, it appears to be forming a Head and Shoulders pattern. A break below the neckline and the supporting uptrend could lead price back to the golden zone—around the base of the breakout candle—before resuming its upward move toward the main target near $39.
Gold has broken below the neckline of multiple Head & Shoulders formations, signaling potential downside continuation. This technical development opens the path toward the projected target around $3100, Let’s monitor whether the pattern fulfills its full potential. #Gold #XAUUSD #HeadAndShoulders #TechnicalAnalysis #ChartPattern #GoldForecast #TradingView...
Gold is extending its corrective move, aiming to retest the ascending trendline support. Is this the end of the correction? Unlikely!
Bitcoin is moving steadily toward its next major target—step by step. A breakout from a rare double inside Wyckoff structure, confirmed by a diamond continuation pattern, has put the bulls back in control. The technical roadmap points us toward the next key level at $108,600. Let's meet there!
On the monthly chart, Silver is showing a strong setup for long-term investors. We can clearly identify two adjacent Wyckoff accumulation patterns, signaling institutional accumulation phases. Price action is following an ascending Fibonacci channel, reflecting a steady bullish structure. After breaking out of the second Wyckoff pattern, a Volunacci projection...
Perfect Volunacci formation, tested the golden zone of the top candle's spread and is going to hit It's target !
The Dow Jones Industrial Average (DJI) recently showed a false breakout above its ascending price channel. After this, it tested a key support level—often called the 'golden zone.' This test suggests that the DJI is now set to swing toward a new high.
Gold has been on an unrelenting vertical rally, but the cracks are starting to show! On the quarterly chart, the price has just kissed the 161% Fibonacci extension of a key channel, a level that often signals exhaustion. Meanwhile, volume has been quietly fading since early 2023, despite this marathon of a bull run with no meaningful correction yet. Is the market...


