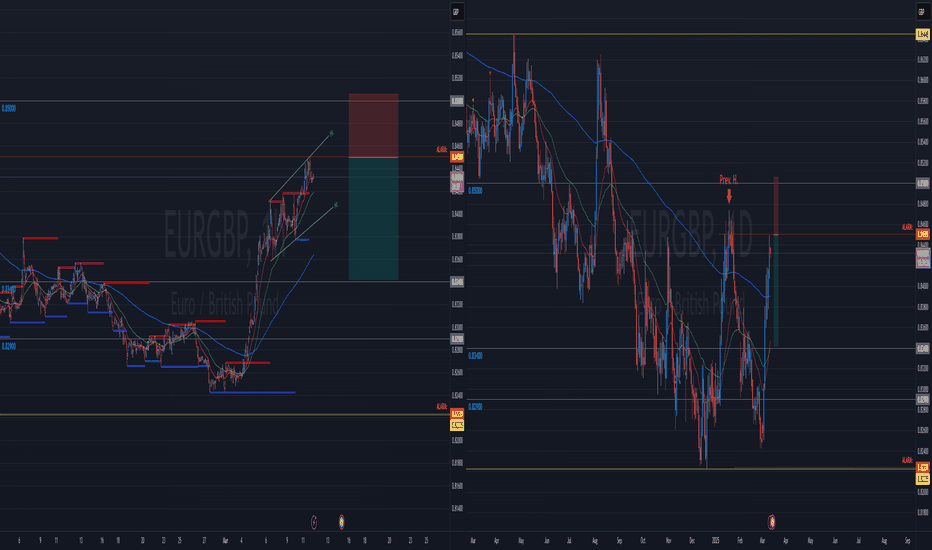
Interesting setup !! On daily Chart, It shows a long time Bullish move to 2.27000. However, It seems it's has been stopped or slow down. On 1 Hour Chart, It has created a Rising Wedge, which is Bullish to Bearish reversal. If you trade reversal opportunities, this can be a good potential.
On Daily Chart, Overall it's a bearish move. in the recent Bullish impulsive, it couldn't SO FAR, reach the previous high. this failiur so far, is the sighn of Bearish continuation. It seems it's creating Shooting star. On 1 Hour chart, it has created a "Rising Wewdge" which is the sign of reversal from Bullish to Bearish. Just watch this pair and trade it as...
On Daily, it clearly pulling back from impulsive Bearish move for a long time. In the Rising Wedge OR it can be a reversal the previous Bullish move did't reach the previous high. this means that it might go back down one more time. On the lower time frame, 10Minutes, it seems, it's pulling back "Correction" . If the trend line breaks and confirms, I would...
On Daily, price broke through Monthly trendline (Red Trendline) but stopped short from matching previous Lower-Low. On 1H, we can see that price was rejected as soon as it hit the Blue Daily trendline and bounced off. In my opinion, we should wait until it hit the Daily Blue trend line or make a Double Down formationand tyhen go for short Bullish reversal.
On Daily, We hit 200 EMA (BLue Line) and reversed the move as this was a major pull back since Mid January. Price failed to match the previous High and it seems it's poinsed to go back down, so far. On 1H, we broke through all three EMA (200, 50, 20) and match the previous low at 1.25600. if we break through this support, we can go down to next psychological...
On Daily, we notice Lower-High one after the other, and threee on the row. This Friday, it made a Spinning Top Doji which is a Bearish Candle. It also, Making Lower-Low sharper than Higher-Low. On 1H, It has made a inverted "V" reversal with a presize neck. If the neck breaks, and confirmed, then Bearish move is the game.
On Daily, it formed a Hammer candle formation around psychological Support / Resistant of 0.56000. It also, failed to to match the previous Lower - Low. On 1H, It seems that it's forming a Inverted Head & Shoulders. It's too early to call it. It may hit the Trendline (Blue) again and if it fails to breake it, it will be a good a counter move. Just watch it !!!
On Daily, it attempt to break the psychological Support/Resistant of 149.00 to continue Bearish move and it failed. 149.00 is pretty strong number. on 1H chart, you can see that multiple attemp to break now "149.00 Support". It's time to pull back up and retest and that is how the Bullish opportunity appeard.
On Daily, There is a nice uptrend since Mid-November. the price came down and touch the trendline, and failed to close the previous Lower Low. There is a very important historical Support/Resistant at 0.94000. If breaks through and move Bullish with confirmation, ther ewould be a great uptrend opportunity. On 1H, it seems price rejection from the ttrend line is...
On Daily chart, in the past 20 days, there have been multiple atempt to break the 166.00 Psychological Support/Resistant and it failed. ther is a great chance to pull back from Bearish move and price is over extended from EMAs. On 1H chart, It seems the price is setteling down and getting ready for reversal to 167.500 area.
On Daily chart, it shied from previous height and a big Doji followed by a bearish candle. It seems that it's poised to continue the bearish move. On 1H chart, It seems the correction uptrend is over and the break is confirmed. As of this moment, all three EMAs are Bearish.
On Daily, This pair is going sideway for months. However, any time it reached the upper side of the box, it bounced back down. It seems Sellers are pretty strpong at that point. On 1H chaart, we can clearly notice a sharp "V" formation with a nice presize neck. (blue lines). the target for bearish move can be around 1.12500.
On Daily, price is by psychological Support 1.63700 that needs to be watched. Once you dig in, you will notice is not perfect, but good Head & SHoulders set up that has a perfect neck. Watch it and see how it goes. It could be very well a great reversal on the way tothe upside.
On Daily, it was a big long and suddent Bearish move last year around Jully-August. The pull back created a huge Rising Wedge for months. Last week that Rising Wedge was broken as well as 189.00 Psychological Support and Bearish move will most likely continue to 187.770 area.


