Hani_Hozhabr
If the bullish channel holds the price at the bottom ( 0.12_ 0.2 based on fibo retracement) the long-term target will be at least $9 (and $20 in the most optimistic scenario) on 1st quarter of 2025
**the chart INVERTED!** compress leg up to the resistance (support), a rising (falling) wedge is formed, inside a triangle is formed, and bothe of them are broken downward (upward). DOUBLE TOP (DOWN) DIVERGENCE ON RSI. first target is 0.032
On weekly chart, we can see a pull-back to the broken horizontal level which is a buy opportunity. targets are $6.15 and $10.8 stop-loss under the grey box. Good Luck!
Adam&Eve pattern on monthly time-frame. In case of break-out of $146 the target will be $220
Trigger line is broken first targer $620, in case of break out of the mid-line of the channel, next targets are around $670 and $700. A daily close below $563 will invalidate the analysis
inside a rising channel. bearish trend line is broken and pull-back is completed. if the supports hold it in short-term, top of the channel will be the long-term target
inside an ascending channel. If breaks the triangle with flat top, the targets are available.
According to the history of the chart, we can expect to reach the top box ($24-28) after breaking out of the mirror level
consolidating above MAs. Breaking out of the blue box will lead the price to the yellow boxes in mid-term
made a higher low after several weeks since 2018 and waiting for a higher high to confirm the up-trend, so that we can expect to reach the targets
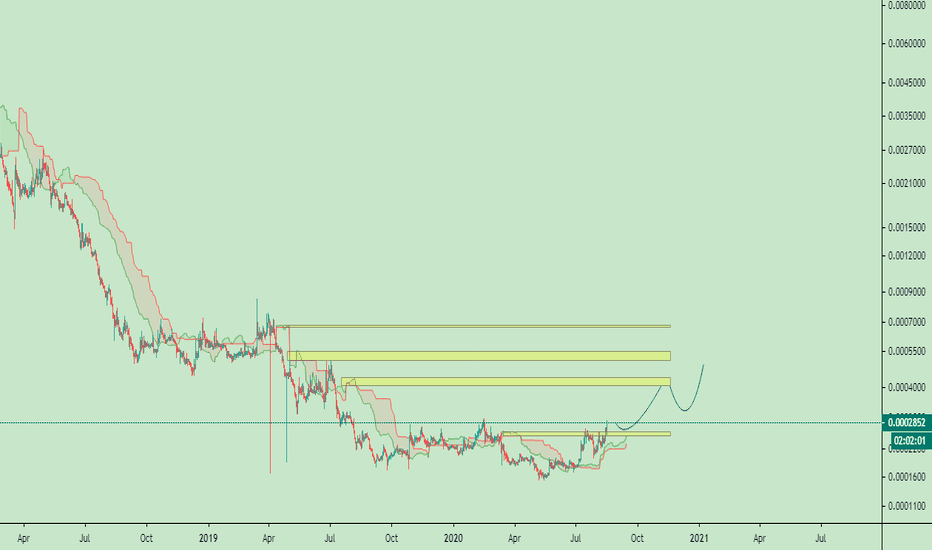
the first benchmark in ichimoku is broken-up and we can expect to move-up to the next two benchmarks. obviously the trend is upward.
in case of break out of the trigger line, a 200% move up will be expected
triangle with flat top modified pitchfork bullish pattern
very simple classic pattern . an obvious bullish flag pattern


