This is the S&P 500 divided by M2 money supply. It's been remarkably prescient, IMO. I will continue to use it as a macro guide.
If we can hold about these longterm trendlines, we can see a huge altseason launch from here.
This is an amazing chart the shows real-life performance of SPY adjusted for the Fed printing money. As you can see, the real SPY peak was in 2000-2001. This is the Monthly candle chart.
This is an amazing chart the shows real-life performance of SPY adjusted for the Fed printing money. This the Daily Candle chart.
In looking at the lines I've drawn on QQQ the last year or so, what stands out is that when QQQ breaks decisively below uptrend support lines, it has always been eventually fatal. (I feel like a moron for not believing my own TA on May 3 and 6 when I should have opened a massive short with tight stops. I agonized over the charts on those days, but the bulls had...
I drew these lines awhile ago. Here's the updated action. This chart serves as a companion to my QQQ charts. I'm shorting QQQ with ~75% of my short position and shorting SPY with about 25% of my short position. See my QQQ chart for detailed macro reasons I'm short, most of which also apply to SPY.
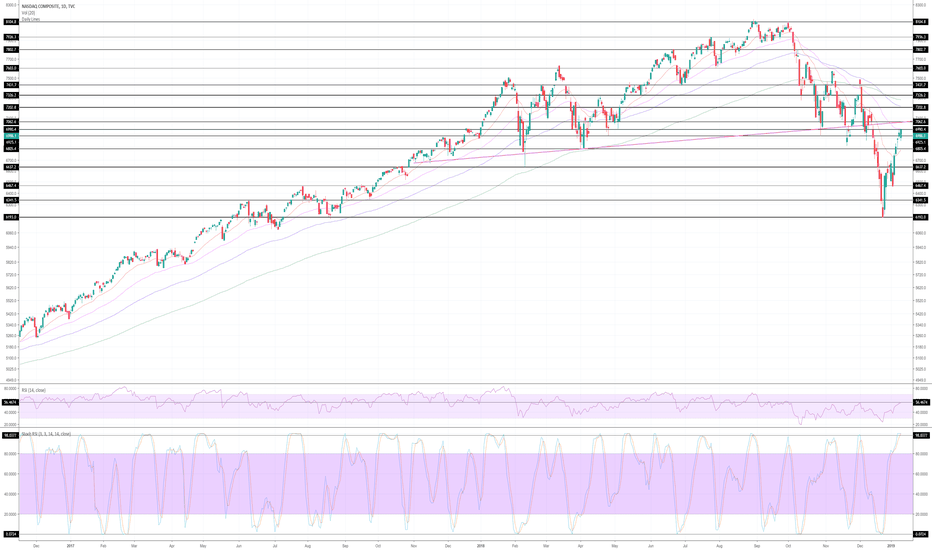
This is just a quick and dirty chart I did tonight for the Nasdaq Composite as a companion to my QQQ chart, which is the primary thing I'm trading right now. Given the high degree of correlation between the indexes, I've realized I need to keep a closer eye on this superset index and other indices to catch my pivot points more accurately.
Everything about this chart and the underlying trends are so, so bearish. Here's a quick list: Just below or in a major resistance zone formed from major past support for huge bounces Just below 50 DMA, where we could see strong rejection. (Still well below 100 and 200 DMA.) Rising wedge or bear flag RSI is at same place QQQ dumped from before. Also my buddy...
This is simply if you wish to follow my S/R lines on the hourly in the next few days.
I expect a DCB (dead-cat bounce) on QQQ soon, but not sure when. Watch RSI 22. $119.69 is my eventual target, the start of the Trump pump. Notice very strong RSI/price bearish divergence. I'm more heavily short QQQ because of inflated P/Es and greater runup before this crash. However, I think QQQs fundamentally have better long-term earnings prospects because...
I simply publish this idea so that you can follow the live action on my S/R lines on the hourly. Hopefully my lines withstand the future price action scrutiny.
It seems Mnuchin is rallying the PPT to run a DCB (dead-cat bounce) and short squeeze to $252.87 to test Feb. lows at which point we will resume downward march to $219.63, the strong floor of the Trump rally. I have taken 50-80% profits on my puts and am looking to reload after a relief bounce. It's tough for market to drop this much without a dead-cat bounce....
If there's one theme that's emerged in my #MJOTCs portfolio, it's that the companies/tickers that follow the MJ cycle, but which don't fully retrace to old lows on the downturn, are the strongest performers coming into the next season. We saw this with KGKG, SIPC, and a few others I'm forgetting right now. The other theme that has emerged is that of hemp/CBD...
SIPC broke out of its massive 10-month downtrend/wedge a week or so ago and is doing some nice "run, consolidate, run, consolidate" action with a strong and consistent push higher. It is now approaching another key breakout point: the $0.0615 to $0.0630 zone of resistance. If it can breach and hold that, it has a big gap of blue skies without resistance and very...
AMD just lost key support and is plunging into a huge low volume chart gap without support. I bought $20.50 puts. Extraordinary earnings after hours today could save them, but chart looks extremely bearish. Earnings are expected to show greatly slowing growth.
Above are the KGKG support and resistance levels. I love how the 20 day MA provided support for this bounce and I love how this hump fractal lines up with the previous hump fractal. Can you spot where we are? My drawing tools on TradingView are glitchy today or else I'd draw it for you. Guess what comes next?
GAHC is getting a lot of buzz. The chart looks really nice with a double-bottom on huge volume. I've marked a few key resistance levels. I've held this for a bit now, just averaged down with an Ask slap.


