Hari-Ram-Kumar
Its a long time since my last analysis being documented publicly and so an end to end analysis should refresh the memory of what's going on with this pair. Let's start with super long time frame-the yearly time frame and drill down into lower time frames. Year-->Month-->Day-->Hour shall be the approach to resolution Chart 1: Yearly Statistical view: Yearly...
Price action after a long bullish run had taken a pause, and the pause seems to be over. Interpretation 1: As there were 3 complete waves formed in the bullish trend and the recent motive wave was slower than the earlier motive wave which might indicate that the formation could be an ABC. Recent correction could be a long term correction which might be an X...
This weekly chart shows that the encircled price action displays bullishness where the shaded area was an intermittent bearish move. This bearish move divides the bullish move into 2 waves as shown below The daily chart can be interpreted as Option 1 Option 2 The common area of time and price move equivalent to the previous move is The recent...
My view on the short term forecast posted in the linked idea is revised: The recent price action is bullish after correction but it is slower than the previous motive wave. Hence I am concluding this wave as an ABC wave. Wave C has a potential to move upto 100.4 but not certainly if extends beyond Dec 6 2022. This wave shall conclude on or before Dec 6...
Long term outlook on monthly chart shows that the price action is on a major correction. The highs and lows inside the correction area look like this This could be a triangle OR A flat OR Based on momentum of price action, the chart could be resolved as If the running flat was predicted correctly then the next motive wave to the upside should be...
Chart 1 - I would not prefer to enter short if the price breaks below 82.0803 because the present move lacks momentum to downside. It seems to be a corrective move to the previous upward move. I would wait and watch the market for clues on building momentum to the downside. What to expect? Chart 2 - Possible moves are depicted as follows to wait and...
Triangles are corrective patterns and diagonals are motive patterns. Upon completing a triangular pattern the trend resumes. Ending diagonal marks the end of a major wave or a trend and signals upcoming trend reversal or major correction. Leading diagonal marks the start of a major wave or a trend after a major correction or reversal to previous trend. After a...
Yo! it's a long time since the last update. So what has happened mean while. Chart 1: Price action resolved into a flat and had continued lower So what's next. Chart 2: Expect price to hit 81.4856 before on or before 22 April 2022 Chart 3: Price is under consolidation in 1H chart. Expect the consolidation to end during 14 April 2022 to 15 April 2022 when the...
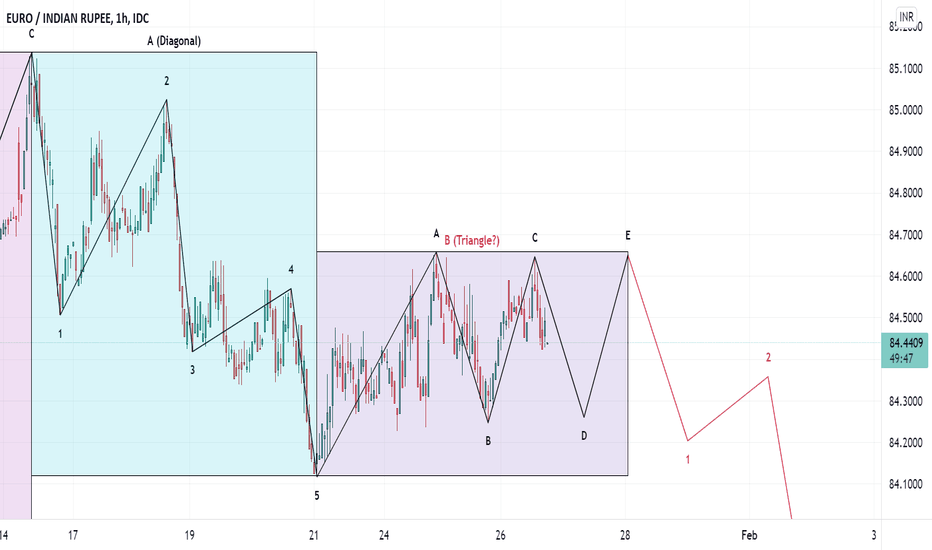
Yo!! the price broke below 85.2494 but late beyond 15/02/2022 forming a diagonal wave A or 1. The break was followed by a consolidation forming a triangle wave B or 2. Triangle consolidation was followed by wave C or 3. Chart 1 shows the patterns. Chart 1: What to expect now? In wave C or 3, minor waves 1 and 2 are over, wave 3 is in progress and might be over if...
Price action had given some clarity now. Chart 1: Shows the first option, where the price is now expecting to hit 0.64500 by 19/02/2022 to 25/02/2022. Chart 2: Shows the second option, where the price can form a B variant of C elongated triangle followed by wave C. However the targets remain the same. Trade setup: Trade position: Short Entry area: Upon break...
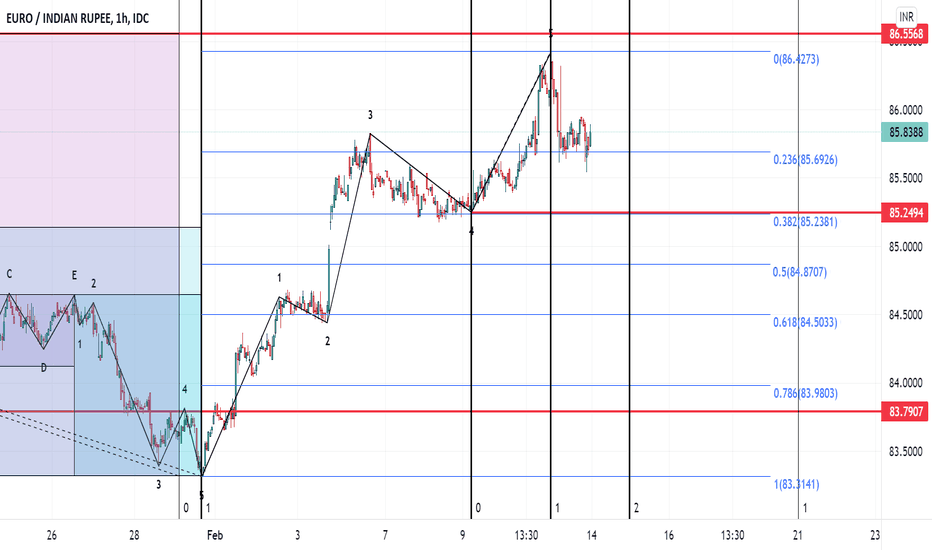
Chart 1: What is going on with this pair after wave X in Chart 1? I really have no clue but could guess the following patterns. Option 1: - Chart 2 If the price does not break above 86.5568 on or before 1/03/2022, then this could be a triangle which forms Major Wave Y. If the price breaks above 86.5568 on or before 01/03/2022 the this could be a flat correction...
Option 4 (chart 4) in Update 10-EUR/INR was misinterpreted or I missed to notice the trade opportunity in this chart. However a lesson learnt without any loss. But finally the price action in "wave B or 2" resolved into a C elongated ascending triangle. Now Wace "C or 3" is in progress. Refer Chart 1 below for details: Chart 1: Now my duty is 1. To spot wave 4...
Price might either follow black path or red path. Rationale shall be discussed in detail in the next update.
As expected in as stated in UPDATE 9-EUR/INR trade setup the price had hit and reversed at 84.6583. But the reversal to the downside from 84.6583 was not strong enough. Refer Chart 1 for details. Chart 1 Hence this downward wave is a correction wave to the previous ABC wave and this could turn out to be a regular flat as shown in chart 2 Chart 2: Option 1 Chart...
The pattern mentioned in Chart 11 of Update 8-EUR/INR given below turned into a major correction forming and irregular flat as shown in Chart 1 Chart 11 of Update 8-EUR/INR Chart 1: Price action had formed a Diagonal pattern to the downside after this correction. Right now the price is correcting the diagonal pattern which is expected to be over by 25 Jan...
It's pretty long since the last update "Update 7-EUR/INR" and all the targets are achieved and lets check how it had happened. As stated in "Update 7-EUR/INR", the price action broke below 86.8936 on 22 Oct 2021 09:30 (IST) which is before 22 Oct 2021 11:30 (IST) and indicated that the reversal was faster than wave 5 (the ending diagonal). Check out the Chart 1...
Apologies, friends!!! It was pretty premature to conclude in Update 6-EUR/INR (refer the linked idea) that Wave C in 1H chart was over and hence the flat correction in 1D chart was complete. However the trading plan had prevented us from taking short entry as the price action didn't break below 86.8936 yet. Now I believe that the wave C in 1H chart is over with...
Targets predicted in idea titled "Update 5-EUR/INR" (linked as related ideas) are achieved. Wave C in 1H chart is over which completes a flat correction in 1D chart. 1H chart showing internals of Wave C and its 5 wave completion 1D chart showing the recent flat correction And what's next- 1H chart below shows that the momentum of "recent wave" to the...


