HernandezCapital
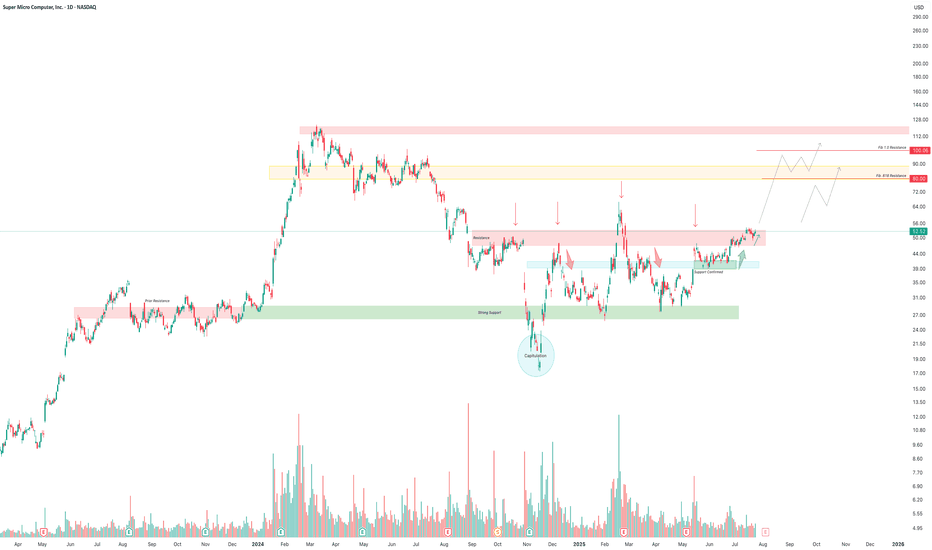
PremiumSuper Micro Computer Inc. (SMCI) has formed a well-defined accumulation base between $26 and $46 after a major downtrend and capitulation event in late 2024. Price action has since transitioned from panic selling to structured accumulation, confirmed by: Strong support at $26–28, tested multiple times, creating a clear bottom. Capitulation low (circled) in...
The daily chart of Unusual Machines, Inc. (UMAC) reinforces a bullish breakout continuation setup, A Bullish flag within its rising channel . 🧠 Technical Highlights Initial Surge: The stock launched from consolidation to a high near $24.00 in late 2024, gaining +1,737% during the move. Consolidation Phase: The price corrected within a bull flag/descending...
Stellar Lumens presents a high-reward continuation trade backed by classic technical structure, healthy consolidation, and macro alignment. A breakout from the 7-month bull flag sets up a potential 5× return, with $1.50 as a technical target. Price action, volume, and altcoin market rotation should be monitored closely to assess the strength of follow-through. Goodluck!
Oscar Health has broken out of a long descending wedge and is now resuming its broader bullish channel trend. With volume surging and smart money signals appearing near key supports, the chart targets a 94% measured move to $26.76, with the possibility of continuation toward $50.00 if trend strength persists. A strong bullish structure remains valid as long as...
This chart shows a clear ascending triangle breakout on the weekly timeframe Strong resistance around $13, tested multiple times (red arrows). Rising trendline support (green arrows), forming the ascending base. A large volume surge (highlighted by orange arrow) on the breakout candle, validating institutional interest and confirming the pattern. The measured...
Applied Digital has confirmed a multi-year symmetrical triangle breakout on the weekly chart, marked by immense volume and a clean breakout above long-term downtrend resistance. The base of the triangle spans several years, with consistent higher lows forming a solid support line. 🔺 Breakout Volume: Massive volume surge confirms strong institutional or...
The chart of Uber Technologies Inc. (UBER) showcases a multi-year bullish setup following a prolonged accumulation phase and key breakout signals: Consolidation: The stock entered a horizontal consolidation phase above previous resistance, now acting as strong support ($60–$80), confirmed by multiple bounce points (green arrows). Measured Move Projection: The...
Planet Labs is currently presenting a bullish continuation setup following a sharp breakout from a base near $3.50. After a 57.7% rally, price has entered a textbook bullish pennant formation, consolidating in a wedge while holding strong above the critical $5.00 support zone. 🧩 Key Technical Highlights: Pattern Structure: The stock has formed a bullish...
Advanced Micro Devices (AMD) has maintained a well-defined long-term ascending channel since 2019, marked by cyclical touches at both the upper and lower bounds. The current setup signals a bullish reversal following a successful retest of the channel’s lower boundary AMD now shows a strong bullish reversal: ✅ Broke above a multi-year downtrend line with volume...
SoFi Technologies has successfully broken out of a falling channel, reclaiming the $13.00 level — now acting as a strong support and technical base. This breakout follows a clear downtrend rejection structure (marked by multiple red arrows), and is now transitioning into a bullish reversal pattern. 📊 Technical Highlights Breakout Point: $13.00 – now confirmed as...
Digital Turbine has completed a multi-year downtrend and recently broken out of its descending channel with conviction, supported by historically high volume (🔶 orange arrow). The breakout above the $3.45–$4.65 range confirms the start of a new bullish cycle. 🔑 Key Technical Highlights: 🔻 Red arrows mark major rejection zones 🟦 Breakout above prior downtrend line...
BTC has broken out of a mini falling wedge pattern . After touching 3 year longterm support BTC now finds its way towards $115,000 per BTC . The RSI accompanies it as in the past once the RSI broke descending resistance BTC rose sharply Target ; $115,000
The chart illustrates a recurring pattern of bullish triangle breakouts followed by explosive 399% price rallies, strongly supported by rising volume and breakout confirmations. Each breakout has occurred after extended consolidation phases forming ascending triangle patterns, a sign of institutional accumulation and bullish continuation. Key points: Breakout...
The 2-week candlestick performance of Uber Technologies highlights a large consolidation zone between $60 and $88. The price is currently testing heavy resistance around $88, a level that previously triggered multiple rejections. A confirmed breakout above this level projects a potential 42% upside towards the $120 –$125 range. Target : $125.00
Looking at the weekly timeframe we can see Dell Technologies is in positive macro uptrend. Price Has respected the channel since the start of given data and continues to do so as well. We can see price has touched the bottom of the channel once again and has confirmed a weekly green candle indicating heavy demand . As we can see the most price has fallen In a...
BABA continues the bullish outlook since we called it last on October 23rd. Babalicous outlook Part 1 : We continue with our update here! Baba has broken through our previous resistance/ area of demand and has perfectly retested the zone. As you can see our Area of demand has always been an area of tough resistance and as of now it is becoming strong...
Can this mini stock pull off another 20,000% percent ? Lets analyze . As we can see 0.91 cent support has always been respected heavily . Back in 2018 when it first made contact with support price rose 6x towards supply zone in which it was heavily rejected.. Rejection was so strong it dropped the price onto the bottom of the stocks channel in which activity...
BABA is Super bullish on higher time frames. Great entry at current prices. A move to the $200 level is expected. Lets see!


