As BTC is stuck trying to convince everyone to stay long, ETH is using its bullish orderblocks really well...shorts are showing signs of letting go in these ranges. Would like to hear your take!
Looked over this for a friend. Rowland I would love your feedback in the comments 🫡 I will see my biggest expectation is for this to make it's way into the weekly imbalance range below the weekly Mother Candle we are existing within. The entire crypto market seems to want to revisit some key lows to correct some inefficiently delivered rally ranges (meaning too...
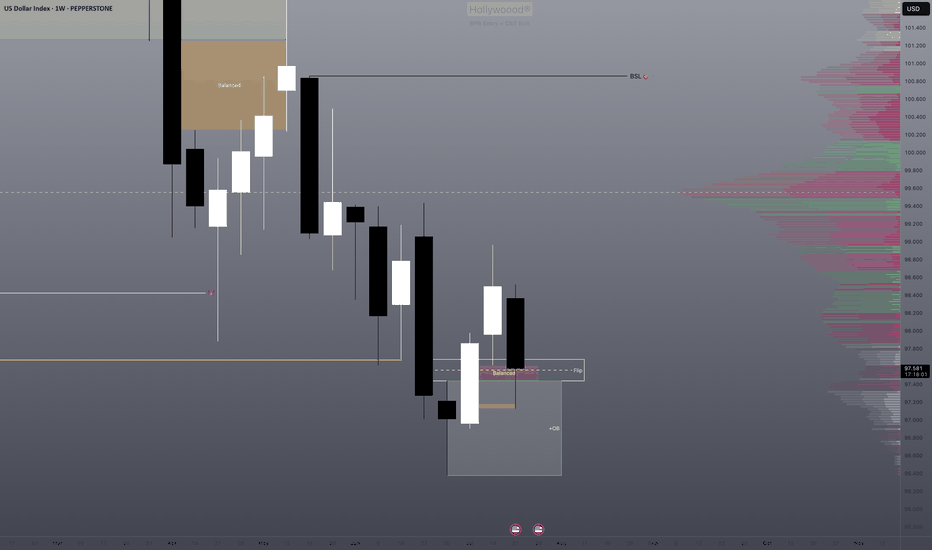
We have an imbalance high being tested. We know that this also represents the consolidation range low where both TPs and long entries will be triggered. Will this be enough to send us back bullish or will be need further correction of the imbalance? I think there's a high probability of this with DXY also running into it's daily bearish imbalance range.
I am trying to figure out what the recent bullish days mean within the overall range. Please let me know what you think 🙏🏾
Everything is explained quickly in the video. Main points: 1) Lows and bullish imbalances respected 2) It's very difficult to short without supply 3) May get cyclical take profit like previous years Be sure to let me know what you think!
Explained in video. Please let me know if there is anything I missed in this analysis! Don't forget to like and share 🔑
With equilibrium being established we are stuck in an internal liquidity range. We do expect the trending targets to be hit although we are seeing a preliminary shift in structure. If there was anything I missed in this analysis please let me know. Share this with anyone who may be interested 🙏🏾
Explanation in video. Let me know if there was anything I missed in this analysis. Share with anyone who may be interested 🫡
All explained in video. Please let me know if there is anything I may have missed in this analysis. Thanks and share with anyone who may be interested 🔓
This is a quick analysis but we are at a key bearish range that may give a double top on the weekly/daily. If this Daily mother candle abides by Candle Range Theory mechanics, we will see it's low taken out. We'll see 🎯
We have a huge dealing range to short into and still remain bullish, it's basically free money on technical retracement/correction while not ruining the market. The retailers have been buying since April but there is no institutional orderflow evidenced by no peak above average volume levels. Technicals will reign supreme here. Trump is either trolling about the...
Please review what I think I'm seeing. If you have any comments in regard to these potential levels they are always welcome. I believe we may be actually bearish from here but without a daily close below the highest block, my decided choice must be neutral. Purely mechanical analysis will save your portfolio 💎 Don't forget to subscribe & share this with someone...
We have a couple of doji candles on the daily chart forming out of a bearish imbalance range in the relative premium. This is the perfect place to test the lows for stops. We are still bullish but I am going to go neutral for this forecast in anticipation of a slight correction. Share this with someone who needs a complete top down analysis of where we are...
We are hunting the next buyzone already. The correction zone is printing now. This is how you accurately forecast your next entry ahead of time. Learn how corrections should work. Long below higher time frame (Hourly/Daily/Weekly) lows is the name of the game. This should be easy work, and you can feel free to look for longs below 15m lows on the way to the...
If you look at my last post, you can see where I explained the expectation. As range theory would state, the rejection from the bottom of a range creates a target in the high of the range. I have identified the candle top that I believe is the target for this rally. If the bearish imbalance is stacked with too many orders we will not make it there. We are...
Been wanting to show you all the mechanics of the correction phase when it happened. A very good formation here, feast your eyes. EASY 🔓
I have 2 zone that are coded as a "no close above" that should have held no issue The reason why I am short mainly is because we haven't visit 50% of the New Week Opening Gap and we have rejected from 50% of the bearish gap above the range. As well as volumetric divergence after the rally. I want to see this gap at least partially filled before anything else...
Look at how these candles are playing with the lows and the body levels both algorithmically. This is HTF bot work


