House-of-Technicals
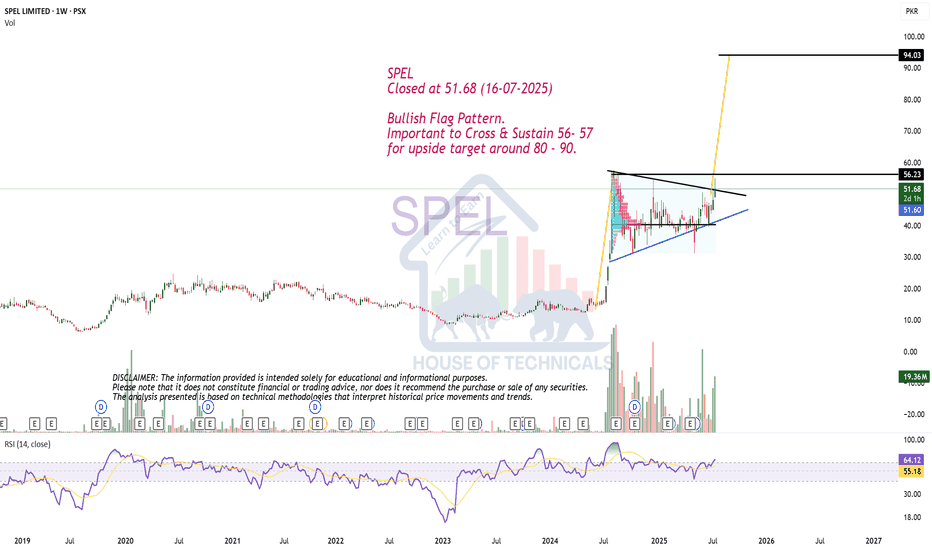
PremiumSPEL Closed at 51.68 (16-07-2025) Bullish Flag Pattern. Important to Cross & Sustain 56- 57 for upside target around 80 - 90.
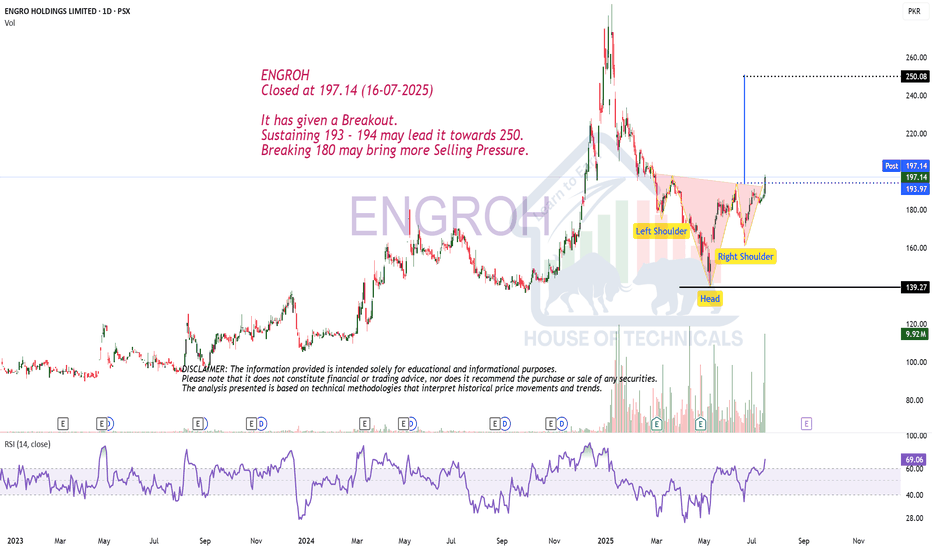
ENGROH Closed at 197.14 (16-07-2025) It has given a Breakout. Sustaining 193 - 194 may lead it towards 250. Breaking 180 may bring more Selling Pressure.
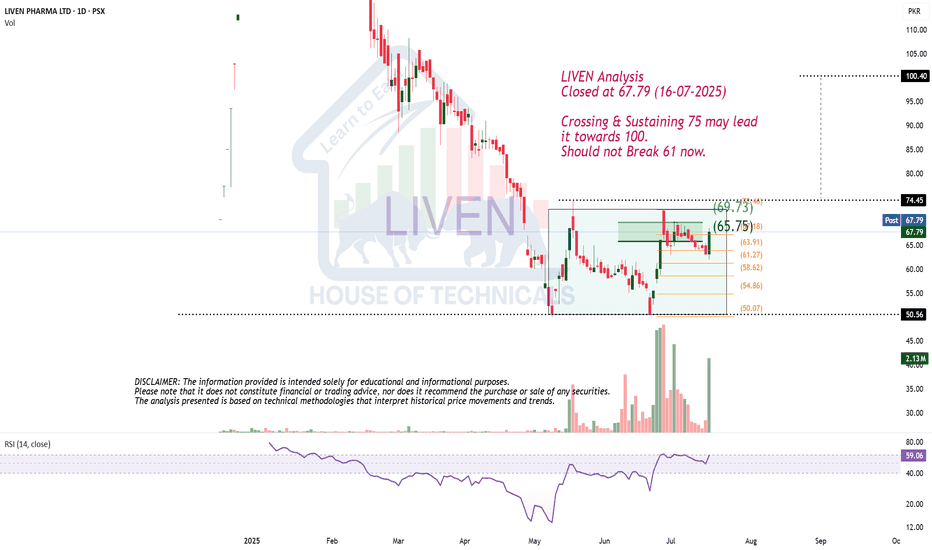
LIVEN Analysis Closed at 67.79 (16-07-2025) Crossing & Sustaining 75 may lead it towards 100. Should not Break 61 now.
ANL Closed at 8.06 (24-06-2025) Currently in a Consolidation Zone. 6.90 - 7.0 seems to be an Important Support Level. Bullish Divergence on Bigger tf. Immediate Resistance is around 10.50 & then around 13 - 13.50
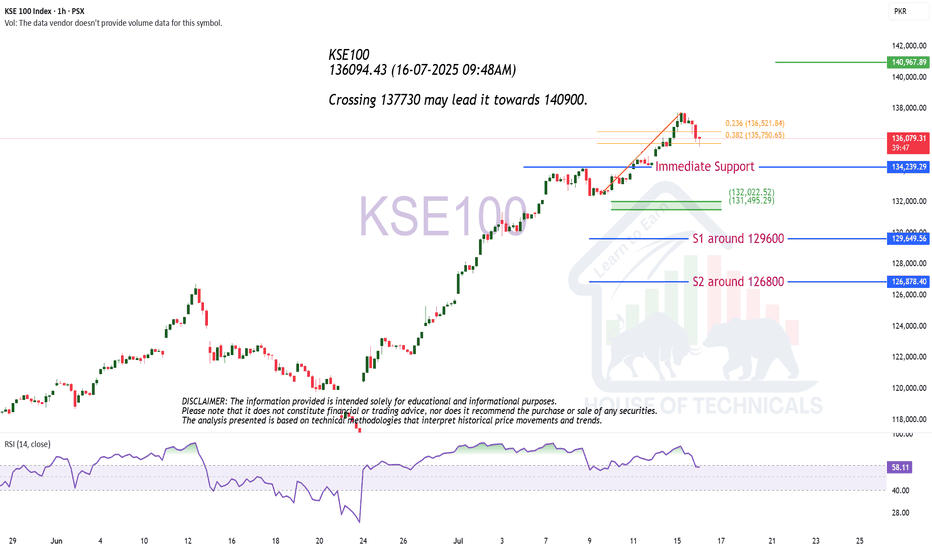
KSE100 136094.43 (16-07-2025 09:48AM) Crossing 137730 may lead it towards 140900.
JVDC Analysis Closed at 68.04 (11-07-2025) Took Support from a Very Important Level around 50 - 51. Crossing & Sustaining 70 - 71 may lead it towards 80 - 85. It should not break 50 now.
FEROZ Update Closed at 362.90 (20-06-2025) There is a Bearish Divergence on Weekly tf. So important to Cross the Strong Resistance Zone around 380 - 410. Crossing this level with good volumes may lead it towards further upside around 500. Important Supports are around 330 - 333 & then around 260 - 265.
Hidden Bullish Divergence on Bigger tf. Perfect Retracement till 30.90 Now Sustaining 43 may lead it towards 47 & then 53 - 54. Should not break 30.80 now. It has the potential to touch 70 - 71 if 63 is Crossed & Sustained with Good Volumes.
FECTC Analysis Closed at 89.84 (11-07-2025) a Perfect Morning Star Formation on Bigger tf. Buy on Dips would be the Best Strategy. Upside Targets can be around 130 - 133 & then around 150 - 160. Some Resistance is around 90 - 93. It should not break 55 now.
HUBC Analysis Closed at 144.18 (11-07-2025) Medium to Long Term View: Sustaining 137 is a Very Positive Sign. Upside Targets can be around 169 - 170, & then around 200+ It should not break 113 now.
BERG Closed at 122.43 (11-07-2025) We may Observe Selling Pressure as it is Currently at Important Resistance level. Now Weekly Closing above 129 - 130.
SURC CMP 146.64 (10-07-2025) Immediate Resistance is around 146 - 147. Crossing this level , may take the price towards 157 - 158. On the flip side, Support seems to be around 105 - 110. Though it is low volume stock but if 158 is crossed with Huge Volumes, 200+ is on the cards Inshaa ALLAH.
FECTC Analysis Closed at 89.49 (09-07-2025) 93 - 103 is an Important Zone that needs to sustain for further upside. However, crossing 92.50 may give a Quick Trade. It should not break 80 now.
KSE100 (09-07-2025 10:20am) Today's Closing is Important. Either it has to Cross its Resistance. Otherwise , it may Test S1 atleast.
TPLP Analysis Closed at 9.72 (07-07-2025) Bullish Divergence on Bigger tf. However, important to Sustain 9.25 - 9.50 Bullish Momentum will start once it will cross & Sustain 14.60 - 16.10 zone. Then the Targets can be around 22 - 24 initially. It should not break 6.20 now.
OCTOPUS Closed at 53.93 (04-07-2025) Buy @ CMP TP1 around 57 - 57.50 TP2 around 60 - 62 Stoploss 50 (Closing basis)
BNWM CMP 77.07 07-07-2025 10:50AM Excellent Retracement till 69. Still has potential to move up again. Immediate Resistances are 83 & then 90 - 93 However, should not break 68.80 now.
4081 Closed at 13.76 (06-07-2025) Strong Bullish Divergence on Bigger tf. Immediate Resistance is around 14.50 - 14.60 & then around 16 - 16.30 Crossing & Sustaining this level may lead it towards 20 - 20.50 It should not break 11.50 now.


