ICpatternsPPL
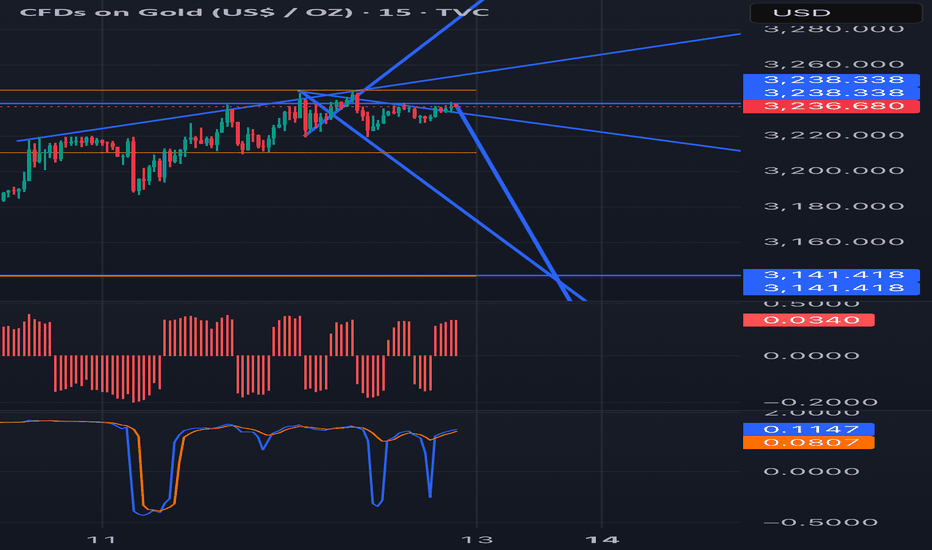
PlusJust put some rays on the chart to show trajectory. Math and geometry well calculated. You can see where it’s going next week, thanks for looking
This is a bias view, bat patterns turned in one direction or another can be considered bullish or bearish. The pitchfork is of a three year multi wave system. It apparently has another wave up from the low as it’s established.
If you notice when you flip through time frames that pivots coincide they’re usually hit by price points. When rejected they tend to go to lower time frames in search of support or resistance.
We’ve been on a range and DXY has a tendency to have breakouts worse than herpes so this to will pass and we should see a rise to a new monthly high
Lower time frame shows a fake out flag but higher time frame shows the bigger picture
Trend analysis suggests this pattern will have a negative influence on price
Retest of upper trend line after breaking lower trendline. 1st resistance rejection means positive ice will look for support lower
Bounce from support to over bought pivot, risk off sentiment. Realistically no rate cuts for another month, highly likely to see support again soon before then.
Trend line analysis shows we’ve had a break of trend. I believe we will see it enter back into trend soon
Lower line back to the upper trendline on weak CAD data
Slight break below lower ascending trend lines. Projected to return to previous upper trend line
Price broke out of upward channel with recent skepticism. I see on the daily chart here where price might stay range bound for a short time before retesting the lower channel for re entrance. I expect price to resume upward momentum
Trend line analysis show’s points of interest in the market and its value as a result of this trend
I think there’s a good possibility for an uptrend for the foreseeable future with this pair
Looks like there’s a downside to a long standing support. Likely a bounce around the 1.04-1.05 range. I think there will be an upward movement after finding that support. Retesting the upper triangle before descending once more.
I expect an upward trend to emerge for a 5 year period. Previously as seen in the 80’s and in the late 90’s a spike in travel to the Swiss alps was visible in the chart.
40 years in the making, we have a good opportunity here to see the 200’s range in the next couple years so buy the dips.
I see a couple moves before the election factors unknown. Geopolitical or supply demand issues. The wedge has held tightly Bob this range.


