ImSamTrades
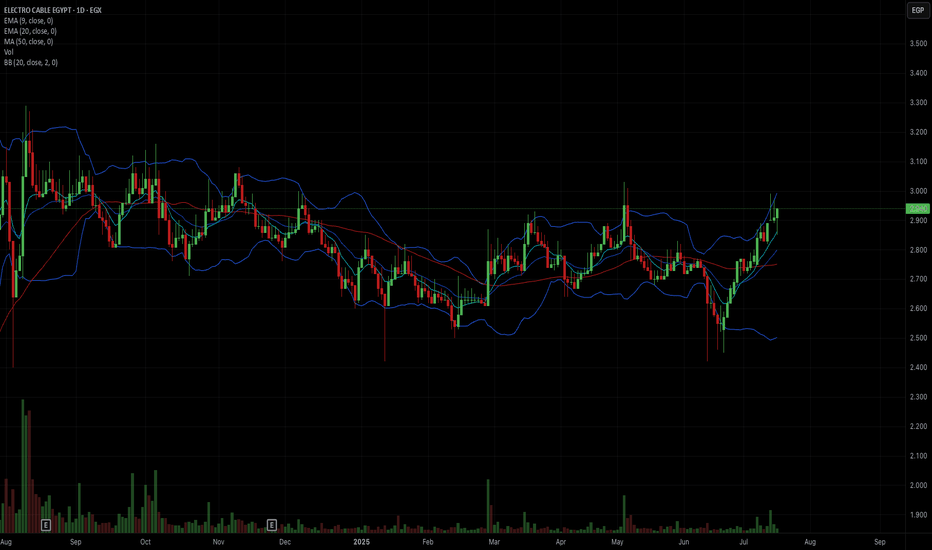
EssentialEntry Trigger: ✅ Break and strong close above 3.00 ✅ with volume surge ⸻ Risk Management 🔸 Stop-Loss: 2.79 ⸻ Profit Targets 🎯 Target 1: 3.15-3.20 🎯 Target 2: 3.40 – 3.50
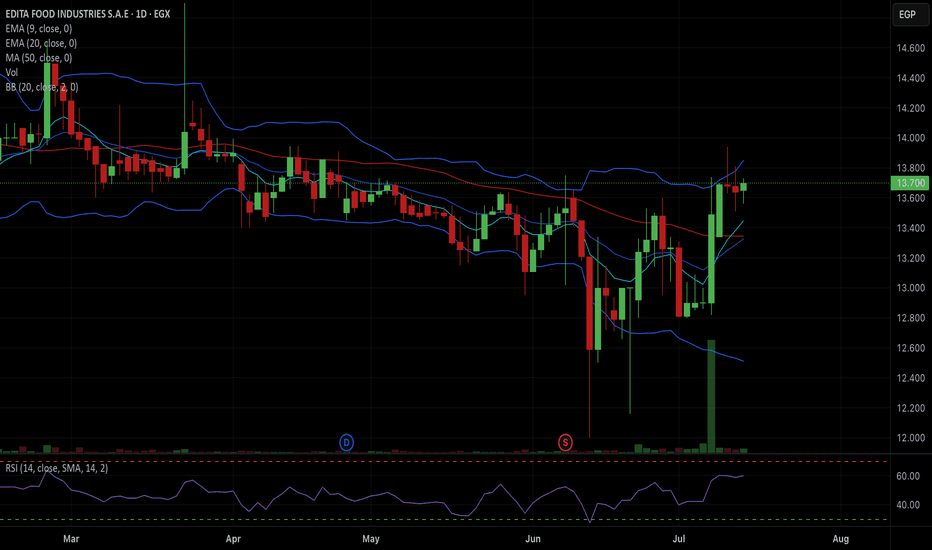
🔹 Entry: Above 13.85 (confirmed breakout of upper BB and resistance zone) 🔹 Stop-Loss: 13.33 🔹 Profit Target: • TP1: 14.20 (next resistance zone – upper wick from mid-March) • TP2: 14.60 (monthly resistance)
“EGCH is setting up for a potential move with strong momentum and a bullish structure. Watching for a key reaction around the 8.40–8.50 EGP zone, where buyers could step in for continuation. If strength holds, upside potential toward 9.20–9.50 EGP is on the table. A breakout above 8.80 EGP with volume would confirm further momentum. Keeping an eye on how price...
ASPI is setting up for a high-probability move, and I’m sharing a rare free trade with exact entry and exit levels. I don’t usually give precise entry and exit details, but this time, I’m making an exception. Ideal entry is at 0.270–0.272 EGP, targeting a move toward 0.300 EGP. Let’s see how this plays out! 🚀 Drop your thoughts in the comments
KRDI is setting up for a key move, with price holding above support at $0.62 and showing strong momentum on both the daily and hourly charts. If it reclaims $0.65 with volume, a breakout towards $0.68–$0.72 is in play. However, a pullback to $0.62 could offer a solid buy opportunity if support holds. Watching volume closely—confirmation is key. A drop below $0.60...
IONQ has been showing strong bullish momentum across the monthly, weekly, and daily charts, making it a high-probability setup for continuation. After a healthy pullback, the stock has been consolidating near key support levels, setting up for a potential move higher toward $47. A well-timed entry on a pullback could offer a solid risk-to-reward opportunity.
- while the weekly chart seems a bit overbought, WBD still has strength and room for a probability of reaching 10.60 by next week and a possible 11.70 by the end of the month. - 9.50-9.40 is a good place to enter. - profit target is 10.60/11.70 - trade is invalid bellow 9 - For call options, use 29 Nov. expiry
- Showing some strength on the pre market, RIOT is bullish above 12.30. - while I am not expecting the move to be bigger than 12.50 on the day, keeping with momentum, we can see it at 13.70 by next week. - a larger move to 14.20-15 may still on be on the table. - Trade is risk off bellow 11.60.
DJT (Trump Media & Technology Group) is showing strong bullish momentum this week, breaking through key resistance levels around $36 with high volume and confirming a potential continuation toward the $45 target. The weekly chart highlights expanding Bollinger Bands and solid price action, while the hourly chart shows bullish EMA alignment and strong momentum,...
LUNR is showing a strong recovery after bouncing off the $16.50 support zone, with buyers stepping in to defend the level. The price is currently consolidating near $17.50, and a breakout above $18.50 could signal bullish momentum toward the $19.50–$20 resistance zone by tomorrow. However, if $17.50 fails to hold, the price may retest the $16.50–$17 area, which...
IREN Limited (IREN) is setting up for a potential breakout, with the price holding above key support at $11.80 and strong bullish signals on both the daily and hourly charts. Bollinger Bands are tightening on the daily, hinting at an explosive move, while volume spikes and EMA alignment on the hourly suggest upward momentum. Watch for a breakout above $12, with...
- 32.87 is a key support area, breaching it and chances of CHWY poking the 39 this month is weak. - look for 35 call this week with profit target around 36. - On a monthly time frame this can go to 39, but thats all depend on keeping with this bullish momentum. - Resistance are likely around 34.49, 36.72 and 39.56
AI showed a lot of strength in the last month and the momentum is still on. 30 area is a probability of where AI can reach this month. - For buying options especially OTM look for the 29th expiry or later better.
- For a ticker like HRHO with all its outstanding shares to be holding like that may be signaling a continuation to the upside towards ATH. - trade it on a breakout or buy it now with a clear risk defined. - Im being asked to give a price to where it will go but I lost my crystal ball. - Size according to your risk tolerance, there is no certainty in trading.
- While the whole market is trending with no questions asked, ECAP is still hanging where a great R:R exists. - But, it in fact went up a lot from high 18 to high 23.
- A beaten down ticker is not that attractive until the market says so. - it is still hanging around a good entry area. - the upside short term may be limited to 0.50 to 1 pound of gain (aka 7). However OBRI has a history of being highly volatile, do we get that during the coming months?
- Consolidation after an impulsive move with a resistance around 3.08 - Breakout from this level can send it to 3.20 - 3.30 (3.40 or higher if the market keeps its momentum) - find a good entry and set a stoploss with a good R:R. -Size only to your comfort level because its all mere probability.
- Probably the best looking chart at the moment in the market. - market needs to be bullish for this trade to work. - its hanging now around a good R:R. - We have a gap on the monthly around the 16.40. Once we break the 14 area, we may get an impulsive move towards the gap.


