The OANDA:XAUUSD price action seems to have morphed into a fourth-wave triangle. If true, we anticipate further sideways price action for the rest of the summer.
NASDAQ:MSTR : We cannot ignore the downside risks at this point. With $430.35 intact, NASDAQ:MSTR is poised for a significant downward move toward the March lows or lower to complete wave (C) of a simple zigzag correction.
Potential Peak in place following a completed five-wave advance with an ending diagonal in the fifth-wave position. The uptrend has indeed entered its mature stage.
NASDAQ:TSLA : The stock failed to recover last week and registered consistently lower swing highs. Unless we see a decisive breach of $250, lower lows are on the table.
NASDAQ:AMD - Breaking the trend channel's lower boundary is additional confirmation the five-wave advance has peaked and a larger correction is underway. Upcoming rallies will probably be B-wave phonies. Looking for more pain this year before secular bull trend resumes.
TVC:DXY - has been trading lower from the 110 peak in wave "c" of a larger flat. We are currently in the late stages of wave (3) of "c".
📈 The US Energy Sector has completed a textbook corrective pattern, ideally a fourth wave. ⏺️ If the 74.49 low holds (-7% decline from today), this sector has the potential to gain at least 23% over the coming months. 🟠 A breach of 74.49 invalidates this outlook.
OANDA:XAUUSD - The higher degree wave ((3)) from the weekly timeframe has peaked. Trading out of the channel's lower boundary and then below 3012 will be additional bearish evidence a larger wave ((4)) is in play.
NASDAQ:TSLA - NASDAQ:TSLA - A sustained breach of $269 opens the path for a gap fill towards 250-244.
OANDA:XAUUSD - A barrier triangle wave ((iv)) likely done at 3012. The post-triangle thrust will see price above the previous high.
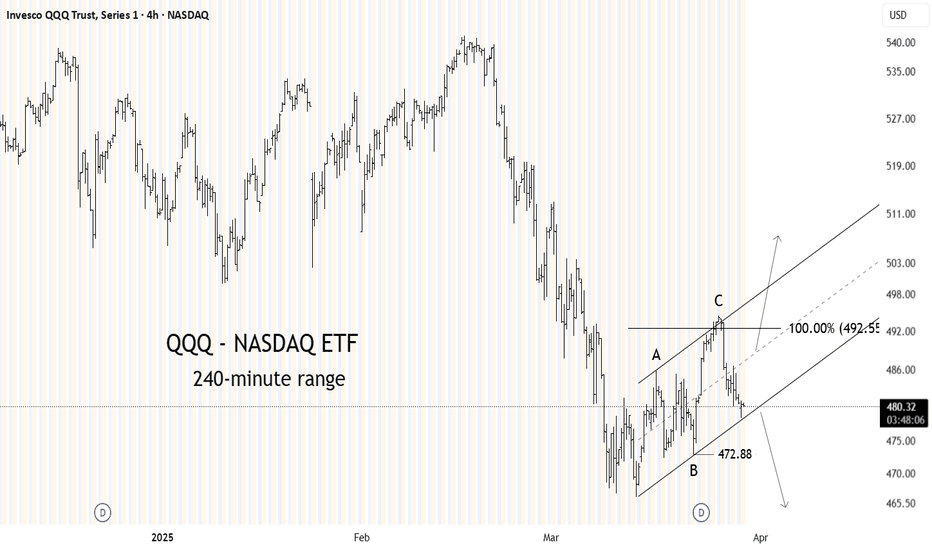
NASDAQ:QQQ - The rally off of the lows has been in three waves thus far. For the downtrend to continue, price must take out 472.88 . If not, the market could unfold a double zigzag or a more bullish scenario, i.e. a 1-2/i-ii setup.
OANDA:XAUUSD - Quick discussion on the post-triangle thrust rally; ideal target and the line in the sand. #Disclaimer - This analysis is for educational purposes only and should not be construed as trading or investing advice.
OANDA:XAUUSD - In a nutshell, the net session volume should stay above the 0 line for the buyers to continue pushing prices higher.
OANDA:XAUUSD - The corrective pullback to $3,000 indicates wave ((v)) is now underway. Minimum expectations require a breach of the previous high and an ideal advance towards/near the 3100 handle.
NASDAQ:TSLA has completed an ideal double zigzag rally from the lows. Breaking below 271.28 will open the path for a larger down move; however, lower lows will be confirmed upon a breach of the 233 handle.
OANDA:XAUUSD - Price is setting up for a lower-degree fourth-wave pullback towards the 38.2% Fib. retracement of wave ((iii)). Once that is achieved, the uptrend will resume.
BITSTAMP:BTCUSD - Price action thus far lacks anything bullish off the lows. The sideways price action hints at a bearish running triangle which will pave the path for lower. Invalidation point: Printing above 94984.42
NASDAQ:TSLA - The rebound from the lows remains corrective thus far. A potential Double Zigzag within a larger downtrend.


