It's only a matter of time before the market stops holding its breath.... Bearish Indicators, Domestic Gov Conflict, Trade wars ...etc
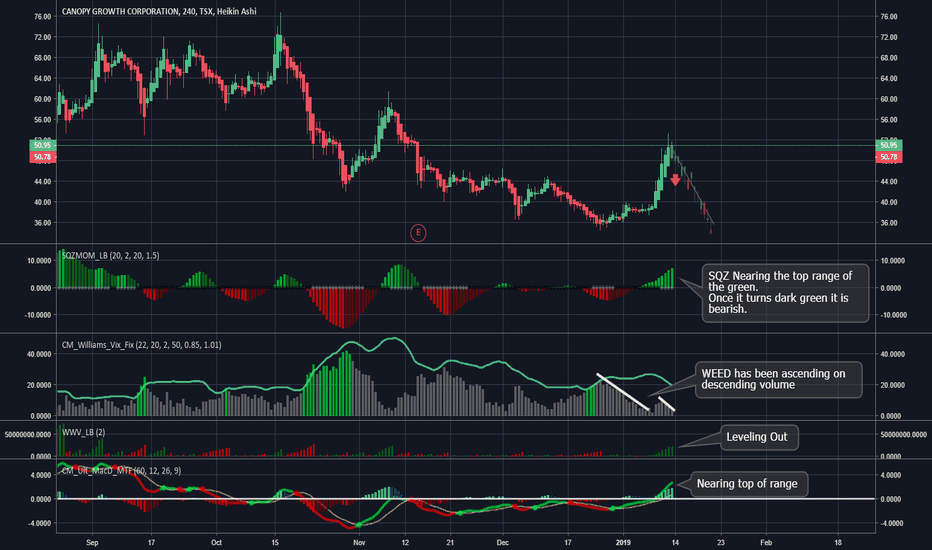
Canopy Growth Corp. has been ascending on descending volume . That is a bearish sentiment. This bull run will come to an end shortly and a more bearish sentiment will take form. The chart follows the bearish sentiment that is seen across the market.
Canopy Growth Corp. has been ascending on descending volume. That is a bearish sentiment. This bull run will come to an end shortly and a more bearish sentiment will take form. The chart follows the bearish sentiment that is seen across the market.
Looking at Morgan Stanleys chart. The SQZ indicator continues to turn hard green. Indicating further down side. The stock has been ascending on descending volume. Bearish sentiment. The MacD is about to have a bearish crossover. The chart follows the bearish sentiment that is seen across the market.
Looking at WFC Morgans chart. The SQZ indicator continues to turn hard green. Indicating further down side. The stock has been ascending on descending volume. Bearish sentiment. The MacD is about to have a bearish crossover. The chart follows the bearish sentiment that is seen across the market.
Looking at Goldman Sachs chart. The SQZ indicator continues to turn hard green. Indicating further down side. The stock has been ascending on descending volume. Bearish sentiment. The MacD is about to have a bearish crossover. The chart follows the bearish sentiment that is seen across the market.
Looking at BAC Morgans chart. The SQZ indicator continues to turn hard green. Indicating further down side. The stock has been ascending on descending volume. Bearish sentiment. The MacD is about to have a bearish crossover. The chart follows the bearish sentiment that is seen across the market.
Looking at JP Morgans chart. The SQZ indicator continues to turn hard green. Indicating further down side. The stock has been ascending on descending volume. Bearish sentiment. The MacD is about to have a bearish crossover. The chart follows the bearish sentiment that is seen across the market.
Regardless of earnings numbers. The Citigroup chart is setting up bearish. Every indicator is pointing down and the bearish sentiment that Citigroup has on its chart is in line with the rest of the market.
Good evening all, ETH looks to be losing steam and a lot of the indicators are turning bearish . Looking at historical patterns. When the indicators line up this way further downside was experienced. Good Luck to all!
Good evning all, Bitcoin looks to be losing steam and a lot of the indicators are turning bearish. Looking at historical patterns. When the indicators line up this way further downside was experienced. Good Luck to all!
After the recent report out from Apple. They are showing lower guidance. This should have been a warning when they didn't release the numbers during earnings.
Litecoin broke out of wedge, Waiting for confirmation.
Broke out of wedge, waiting for conformations, indicators showing short term over bought. Short term Bearish long term bullish
Short term bearish, Long term Bullish The chart seem's like it wants to break out but I think this is a psyh trick to fake a bottom. I see a rug pull to the lower 3K area.
Waiting for the break out confirmation.


