JCore7
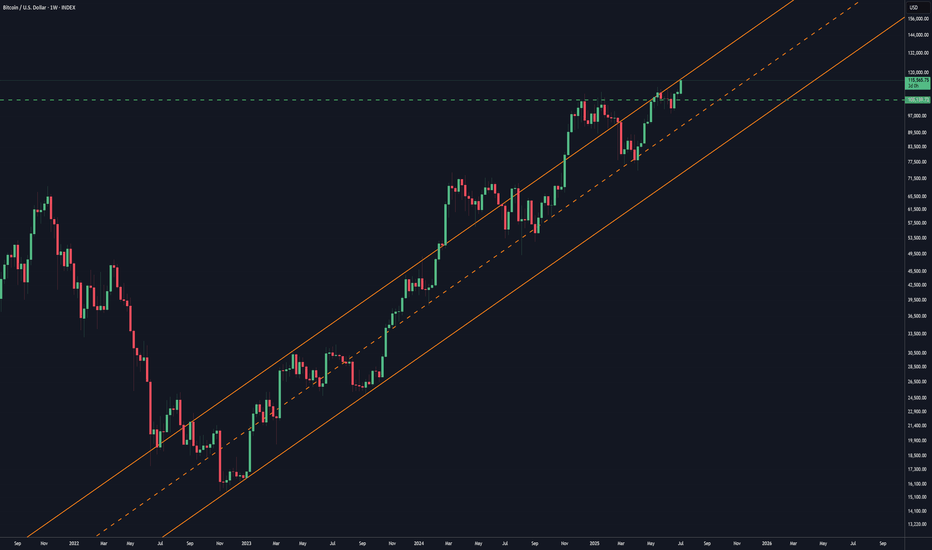
There is of course this quite significant channel that forms the base of this entire move, and also frames back further in time. After all was said and done, this wouldn't be surprising if it contained the price as it has done previously. Not to say it can't be sustained above it, because it certainly doesn't rule anything out, but it's there nonetheless.
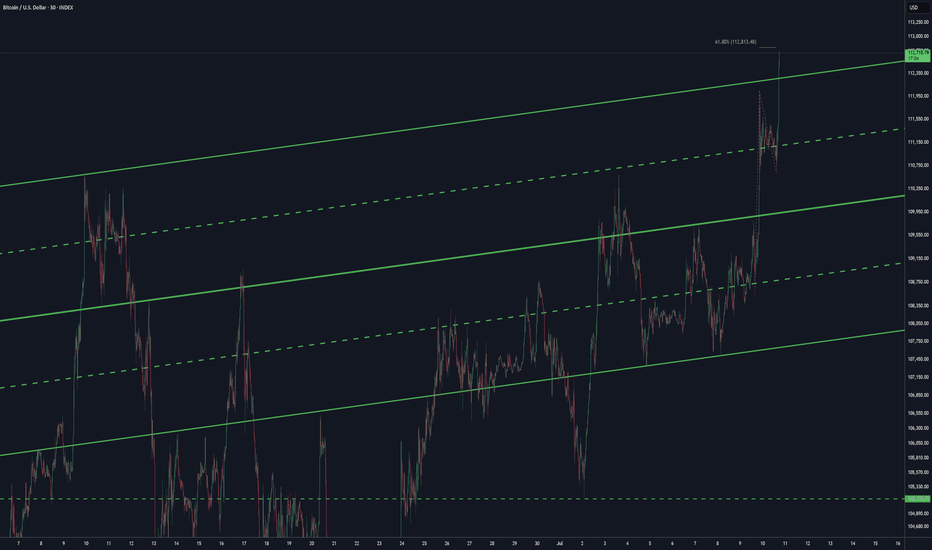
As far as break outs go, this might be all it goes but I'd like to see it get a bit technical and hit that first level at the 618 before retesting the channel. If it can hold up there and maybe flush a bit out, then for me it's an adding opportunity. It might be the last chance we see these prices. It can always be wrong, but that's what stops are for on trading funds.
I've been watching these candles and levels for a while and it looks like this week will entirely trade above the previous resistance at 105,139. I have it possibly hitting a mil by the end of the year-ish, with around 840% upside available if it flushes enough out or has done already and gets through the resistance at 110k. I had been hoping for some more 92k...
I'm reluctant to jump to a conclusion on this count as yet, but it certainly looks like that centre line strike is as much as we get. I can't imagine there would be as big an announcement possible as American Bitcoin, with Eric T "all in ". Well, seems like moon it is then, but nothing wrong with some skepticism nonetheless. I'm not convinced it can't still get...
This next month will be interesting. It's generally been true that price below this 55 month EMA has been the best time to buy and hold. Also the base channel of the impulse wave assumed to be just finished has held since 2013 so any break below that would be relatively quick or else it would start to look like a bigger correction is a significant possibility.
It's waves within waves within waves, well maybe... So now I'm seeing it either as the 1st of a 5th wave extension, or the 5th of the entire move from $15.4k. These levels here should show what's up. Ideally it finds support around the halfway back, but it could go further, maybe the 618. How it gets there as well is to be considered so let's see. But below...
Time to update this chart with a new base channel here as it made a significantly technical pull back to the 618 and a move to the -236 indicating algo participation. If it breaks above this base channel then it's more likely that a larger impulse wave is in progress, with the breakout required for a wave 3 of an impulse. That's not to say it couldn't just meander...
So it looks like the trend will continue here from the previous update. With the equality in rates between the fed and the BoE, both long and short are on the table, but an advance to the upper targets, at least for now, seems the most likely. If it is to do so in an impulse pattern, however, it would need to break above this base channel, which is expected for...
So it's dropped a fair bit since I started writing this post, but needless to say, it would be best to wait and see something technical before a reasonable buy on a pull back could be justified. Looking at the weekly time frame, I'd expect a bounce from about the 115 level, so any bounce could then be judged on its own merits, if it's technical and showing signs...
As I see it, it's always a shake out. This wider market reaction to the Deepseek startup, in my view, is just another opportunity to find a buy. There will still be demand on the inference side of LLMs for NVIDIA chips, regardless, and the current data centres can be used for other tasks than model training. On Bitcoin, what interests me is seeing where the...
Certainly looks like it. Just not sure e is complete. If it plays out as a triangle then either the 50 or the 618 could be the pivot. Below c is the invalidation point but that would likely be a rethink of the pattern and still probably same direction expected for future price. The A-C trendline extended is where I placed the e on this chart. A triangle would be...
This hold in the lower range boundary has come up technical, with some higher highs and lows indicating the possibility of a medium term move to the higher end of the range shown on the earlier chart. Could it still head lower? Sure, it costs interest to hold this at the moment so less attractive to institutional traders. It also has targets way below that I...
If it is, this is a possible roadmap ahead. which is still pretty bullish - a 3 million dollar Bitcoin is pretty bullish. But it still looks like it's weathered the spending frenzy of hitting 100k at Christmas, with any profit taking having a negligible impact on price, for the time being, and it's got more to go on this run.
This looks right on a certain line in the sand, with the higher targets at 65 and above. The monthly close will be interesting and using a simple pair of moving averages, it still looks like a continuation to the upside is more likely than a trend change. But it's very close - it needs to get above this horizontal resistance level with a favourable monthly close.
I decided the lower level shown in the 89s there is my threshold for considering a 4th in progress being more or less out of the question. As long as it stays above there, I think a 4th in progress is possible.
If it's assumed that Bitcoin is going to back test some prior highs from here, then it's of note that the halfway back is close to the end of intermediate 3, which seems a fair candidate for such a test. Of course it's by no means a done deal that minute degree 5 is complete, but if it were, this might be a count in play, implying an extended intermediate 5th. All...
This is just to shoutout the mighty pitchfork. It's a great tool on the shelf. Somewhat subjective use at times but it's a good trend predictor. Failure to hit the median line (yellow) sets up a move in the opposite direction. This median line is quite well reached and the trend is well intact. The rsi has until about the low 80s before it stops diverging but...
Not for me. I'd need to see a substantial drop of around 20-25% to begin with before I expected a deeper sell-off. Just looking at the wave formation here says it still looks like 4th of the 5th is the most likely place in the count. Even what might be scary looking spikes down are bought up quite strongly, at least for now. A decent move down in the weekly...


