JamesRennie
PremiumI have marked the current support and resistance ranges on the BTC chart. The price action on BItcoin lately has been very encouraging for bulls. With a slow but steady move up in price. This quiet creeping of price seems to be common during times of large or highly-educated buyers. This has also shown in sentiment which has remained around neutral. While...
This analysis assumes the case for long ETH has already been made. This company holds ETH a lot of it. First find out how much Ethereum they hold Review their debt and expenses FInd the total number of shares to divide up the total Ethereum holdings With having ETH per share value calculate the adjusted price of those ETH vs market ETH With the...
The chart shows a support and resistance range created by a combination of Fib retracement and Fib extension. The higher low if broken won't be significant. Need to see a higher high for the start of an uptrend.
For months BTC.D has been range-bound between 47.68% and 40.18%. I keep hearing Alt season is coming. When looking at RSI and MACD I don't see strong downward momentum. RSI does not even have much room before it would be oversold. It also has a clear bullish divergence on the weekly chart. Altcoins are further on the risk curve than Bitcoin.
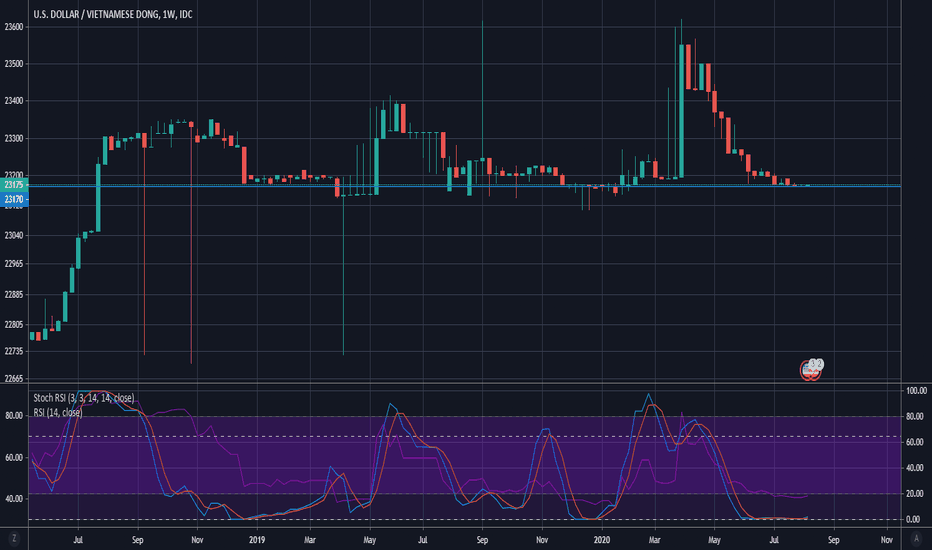
Watching RSI peaking into over-bought. Might be still some upwards space but the sentiment is also shifting to expectation this goes up. Just look up articles on the rising dollar. I have marked some key levels on the chart. Those are what I am watching.
I am long USD or short CAD whatever way you want to look at it. Have been since 1.22 USDCAD. That dollar index has recently crossed above the 200 weekly SMA. Though short-term RSI might cool off a bit with a pullback to 200 weekly SMA. My previous mention of Double bottom on the USDCAD chart still seems good. The real catalyst for the dollar index seems to be...
There is not really enough data to have much confidence this will hold up. I just found it interesting and wanted to share it. The idea is that since at least since start of October BTC price movement seems to be a leading indicator for SPX.
If Ethereum breaks above this level we are stuck at. RSI indicating a pullback. The sentiment is on Ethereum is still high. Still in a longer-term uptrend.
Since the start of this chart this has been in an uptrend. You can see many times it has gone flat. To me this chart is a currently at the bottom of a flat section. One of 2 things are likely to happen next a prolonged flat position where you would not gain of loose much. Or a break out into a substantial rise.
Got Link in range trade. Expecting a trend reversal here with this divergence. Looking to HODL this bounce before range trade sells back to ETH.
Ethereum looks to be hitting resistance. It's likely to see a short-term pullback here. I have marked a range on the chart that is likely for this pullback. Also worth watching the moving average I have added here also.
ETH straight to the moon from here seems to be the current sentiment. I don't think people are wrong in the arguments for the fundamental advancement of Ethereum. They are just early. The biggest complaint by far is about ETH gas costs. People will need to switch to roll-ups and that will take time. Sidechains are a bad idea for very large transactions. ...
Yesterday I posted day chart of ETHBTC. Today the 4h chart. Though on today I see a uptrend on the 4h chart it's into RSI divergence. With the break out and uptrend it's possible price keeps moving with that trend. Though I think it's unlikely. One because of divergence and the other reason being hard fork update today creating excitement. I mentioned this...
Look at ETHBTC there is no trend reversal yet. I see a lot more excitement going into London hard fork. Especially around EIP-1559 that excitement is around the token burn aspect. This seems similar to the excitement around Bitcoin having. When price did not shoot up instantly after having people were disappointed. I think it's likely EIP-1559 has similar...
The recent days of growth on the ETHBTC chart seems like people are too confident for this to be a trend reversal. Though it's not impossible ETHBTC goes up from here. I am watching both BTC.D and the Trendlines for ETHBTC to get a better idea of what will happen next.
This uptrend could be short-lived or just starting. Still not really clear if this is part of a larger correction or the start of a new rally.
Switching to daily sell targets as weekly targets have been passed with exception of 1. Due to the huge rise in price the down side risk is starting to be high. Looking to liquidate percentages of at each new FIB level.
You can see my previous weekly targets. As the excitement is building I'm looking to shorten my targets. I've moved to daily targets. It allows for calculated numbers rather then emotional buying and selling. As we reach a mid market top it could be easy to follow the crowd. Meaning having Dimond hands as everyone cheers you on to HODL. I'll be reducing...


