Jeff_Wheelwright
For several years, the NOK/SEK rate has been moving within a falling wedge formation. Recently, it broke through the lower trend line, and then quickly returned back into the wedge. One of the rules that I use in long-term analysis is: in such cases, there is a very high probability that the rate will break through the second trend line from the opposite side, and...
The US is on the slippery slope... don't buy yet, but be prepared.
One of possible scenarios IMHO: – corrective rally to max 50% of last swing down (~1.085 which correlates with the bottom of the broken channel) – down to OP (100% Fibo extension) = parity – correction – down to XOP (162% Fibo extension = ~0.95 -> just below last bottom) And this will be the end of the next USD rally.
GBPCHF should reach previous top @1.14 after expected GBP rate hike. This is in line with bullish flag's target. Set TP1 @1.1390, sell 50% and let the remaining positions go further up. Good luck
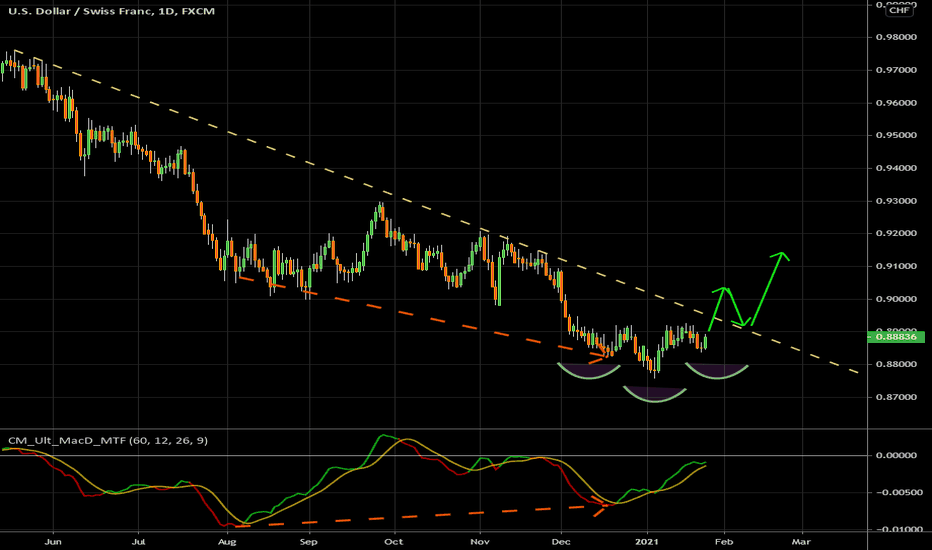
1. It's going to break out of the falling wedge. 2. Bullish divergence + cross on MACD. 3. Rate hike next week.
See the chart. It should go north, especially if COVID hits hard Mexico again in Autumn.
In recent months this pair has formed two structures: 1. Head & Shoulders: If it breaks 85.500 level - open short position (you can also open small position right now with tight SL) and aim for 82.500 (TP1) then 80.500 (TP2, strong support in the past) 2. Falling Wedge: If this pair breaks 89.00 level - wait for confirmation (retest of broken trend line) then...
Look at the chart: there's a skewed H&S pattern, long term trend line (support), and bullish pressure visible on MACD. Switch to lower time frame and buy gradually starting from current pullback. Target is @9.15 (strong support/resistance level which held multiple times during past years). Good luck.
What is a Failed Breakout? A failed breakout is when price momentarily breaks through the support or resistance level, but is quickly rejected. The market usually falls back into the price channel it was in before after a failed breakout, sometimes it breaks down below the price channel. And it can be fast. If it breaks the channel to the downside, it'll reach...
Let's see what we have here... — Clear H&S structure; — Strong bullish divergence with MACD ; — We're approaching medium time trend line . This is a "buy and forget" trade. Not for daytraders. For swing traders. Good luck. BTW I expect a large correction on USD pairs (The US dollar will strengthen throughout next months)
Let's see what we have here... — Clear H&S structure; — Strong bullish divergence with MACD; — We're approaching medium time trend line. This is a "buy and forget" trade. Not for daytraders. For swing traders.
In recent years, the price of coffee has fluctuated between 90/100 and 130/140. It's a nice oscillator. Currently we're in uptrend. After the initial impulse price slows down and is approaching 122 level where correction usually occurs. I expect drop to 115-116 then continuation to at least 130, maybe to 132 (strong resistance) or even 135 (AB=CD & top from the...
I maintain a bullish bias on the USD, expecting a broad rally to unfold into the November elections. Position parameters on the chart, but it has much more potemtial...
First target 1.54, second 1.52, but it has more potential... I open positions without SL, you can set SL to 1.5680 if you wish. MM is up to you.
Possible scenario: retest of broken trend line (upper edge of the wedge, watch lower time frame for confirmation), then up to 1.0850, 1.10, 1.12. Start from small position then add to profitable position (if and only) after every small correction - three drive sell with target @1.12 possible, just like on my chart.
Suggested position parameters on the chart
Several reasons to buy: - It is near the bottom of the multi-year channel. - Regular bullish divergence was formed. - False breakout from the falling wedge suggests strong upside move. Suggested levels on the graph. Good luck.
Silver goes exponential last days. I expect small correction in recent uptrend. Sell at the current price (~18.50). TP = 17.70 (just above weak resistance) SL = 18.80 (just above the projected channel). Good luck.


