Jerry_CTL
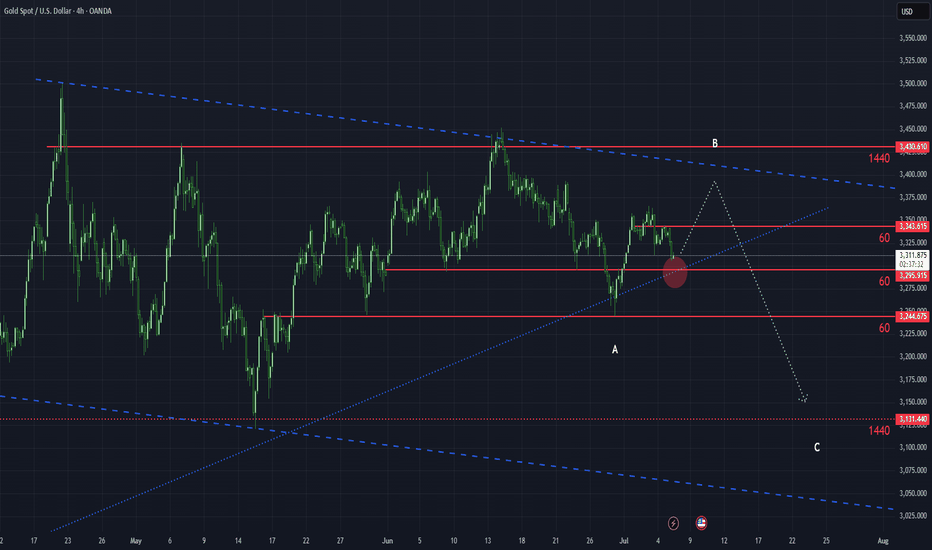
A clear impulse–correction–impulse structure has emerged in the major timeframe. A 1:1 upward movement is anticipated, potentially reaching the upper resistance zone and completing wave 4 of a contracting triangle. Monitor whether the price retests the 3343 level and observe the completion timing of wave C within the corrective ABC structure.
An upward movement is expected at the price level of 3295, followed by a downward continuation after reaching the 0.618 retracement of wave A, completing the ABC wave pattern.
After the price reached the 3249 level, a candlestick with a long lower shadow followed by a strong bullish candlestick was observed. The price has now returned to the descending channel. The lower timeframe shows a bullish trend, but shorting opportunities may appear around the 3295 level.
A descending channel has developed, and a long lower shadow candlestick appeared after reaching the 3295 price level. Short opportunities on the lower timeframes are at the 3343 price level or near the top of the downward channel.
After the price was rejected at the key level of 3435, a bearish trend has developed. Pay attention to the interaction between the downward trendline and the key level of 3343.
The flag pattern in the major time frame did not succeed. Instead of breaking below the 3295 price level, the price was rejected at the top of the descending channel. Looking back, I now interpret this as a leading diagonal that initiated an uptrend. After reaching the previous high at the 3435 price level, a rising wedge pattern has formed. On the smaller time...
The major time-frame correction has formed but did not break the previous high. Although it broke out of the descending channel, it also comes with a wedge pattern. Now, it's time to see how the major time-frame pullback will play out. On the smaller time-frame, shorting along with the rising wedge pattern is fine, but pay attention to whether there are signs of...


