JuanAugusto
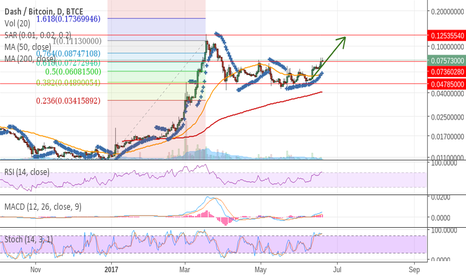
A strong support has been developed at 0.05 BTC, so people is driving DASH back to the top. Notice that the consolidation above 0.08 would break both the current fib level and the top of the sideway channel, thus eliminating any doubt on the upward trend.
Prediction according to: trend, fib, parabolic SAR, MACD and RSI.
MACD and Parabolic SAR, jointly with the bounce in the long-term trend line (blue) and the breakup of the short-term tendency (green) determine that now it is time to buy again.
According to historical Fibonacci retracements, parabolic-SAR and a the recent break upward in MACD, the next objective may be $885-1000. Reaching the lower or the upper bound depends on the momentum of the rally. RSI and volume will give us some hints as the movement develops. There is enough room in RSI to be consistent with the rally, but reaching the upper...
A divergence between the volume and the value of the index indicates a lack of enthusiasm with this new top. This ocurrs just before August, which is a typically bearish month, and under the systemic risk posed by Deutsche Bank. Moreover, NYSE Margin Debt chart reached a peak some months ago (see www.advisorperspectives.com). In my opinion, there is no substantial...
In my humble opinion, it is time to start long positions. The next weeks will be crucial to determine the long term possibilities, and there are some elements that could be signaling the return of the bullish period. Probable break upwards based on: -Possitive SAR -Triangle broken upwards (confirmed by volume), contrary to what could be expected -RSI close to...
According to Fibonacci retracements and fan, and trend lines, we can expect to reach $700 by November.
A pennant formation has appeared and will probably break up within this month. The target price is around $1070, which is close to the last historical top. It coincides with the sum of the breakup price and the height of the the flagpole.
(My previous published chart was hard to see. Here I fix that). Analysis based on: -Fibonacci retracements and time zones -Divergence in RSI and MACD -Wedging trend -Possible cross of 20 MA under 40 MA -Macro instability Potential top in May and subsequent correction. Maybe the great expected one?
-Triangle continuity pattern. -It is expected a break upwards in the beginnings of April. -The intesity of the break is equal to the height of the triangle. -Low RSI and MACD support the break upwards. -Fibonacci levels support the expected height of the upwards impulse. -Objective: surroundings of 700$ in about 2 months.
Elements of judgement: -Elliot waves. -Fibonacci retracements. -Fibonacci timing. -Lines of support and resistance. I expect the price to go down to 4 USD by the beginnings of May.
The hypothesis of my previous chart on the SP500 (see below) seems to be confirmed. Now we can identify the following supports/resistances: 1) 1975-2000 2) 1800-1850 3) 1550-1600 SP500 reached a top in May-June and now it is starting the descent. My recommendation for mid and long term traders is to be short. The risk of being long is now very high; bull traps...
I think that a pitch fan is operating here. It is possible to reach $370-380 by the end of July or in the beginnings of August. The objective results from: -Pitch fan (short-term) -Fibonacci retracements (mid-term) -Fibonacci fan (very long-term) -Possible ascending MACD
The previous analysis is being confirmed. The first possible bottom (yellow) is discarded, but RSI tendency seems to support the next objective in the surroundings of $275-280. This local maximum will coincide with a maximum at the SP500, since it is expected a drop around the end of May (see my related SPX500 idea).
Check my next published idea to see a better visualization of the chart: Analysis based on: -Fibonacci retracements and time zones -Divergence in RSI and MACD -Wedging trend -Possible cross of 20 MA under 40 MA -Macro instability Potential top in May and subsequent correction. Maybe the great expected one?
Fibonacci fan/retracements and trends point out probable near bottom. Long time trends and a double bottom would indicate the end of the bearish tendency. A possible bullish reaction is proposed according to the Fibonacci fan and the main resistances.


