JuanDavidPosada
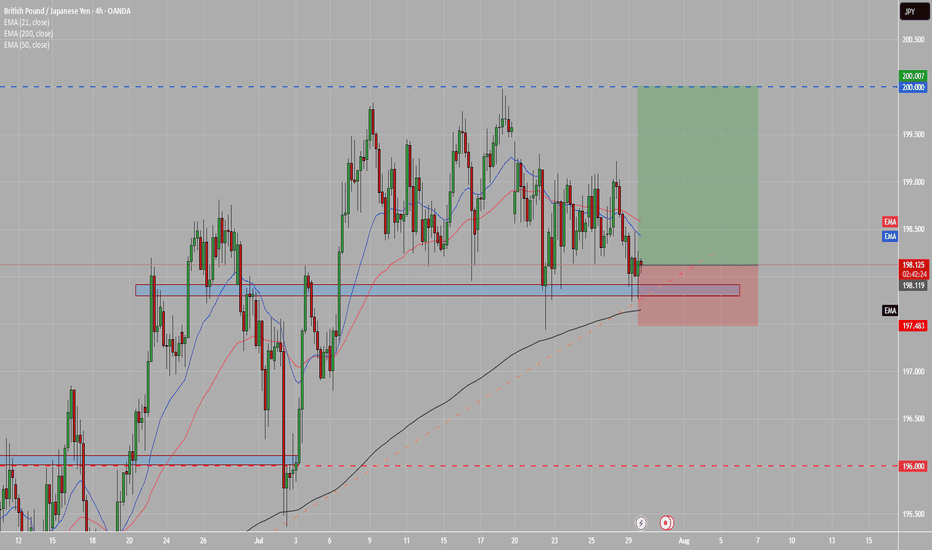
PremiumPlace a long on this one, price seems to be at strong support and TL has help price in previous touches.
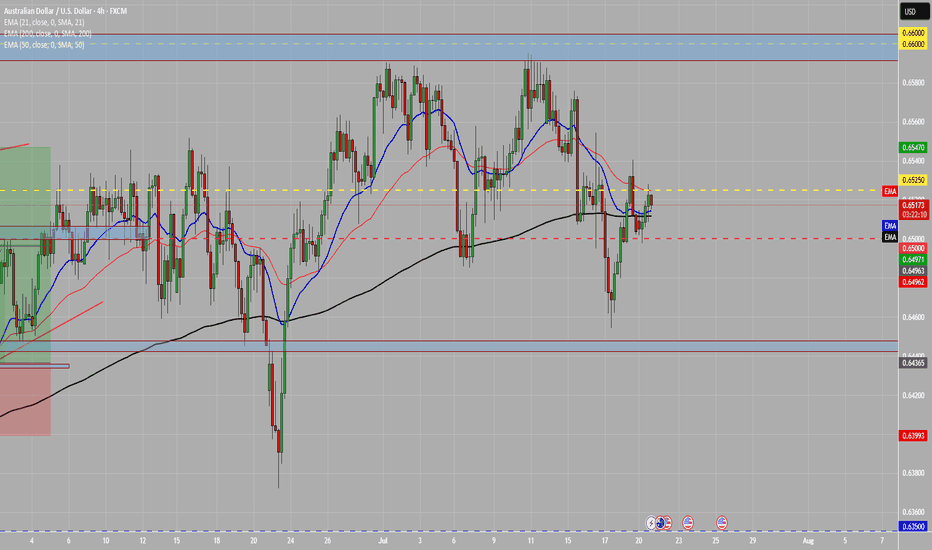
Looking to see what price action does before deciding next trading plan in the short term.
Looking for price to finally break above the daily resistance for price to start a bullish rally towards Weekly resistance marked in green.
Looking for a nice retest at the daily support zone, if this holds true price will start to look for monthly resistance marked in blue.
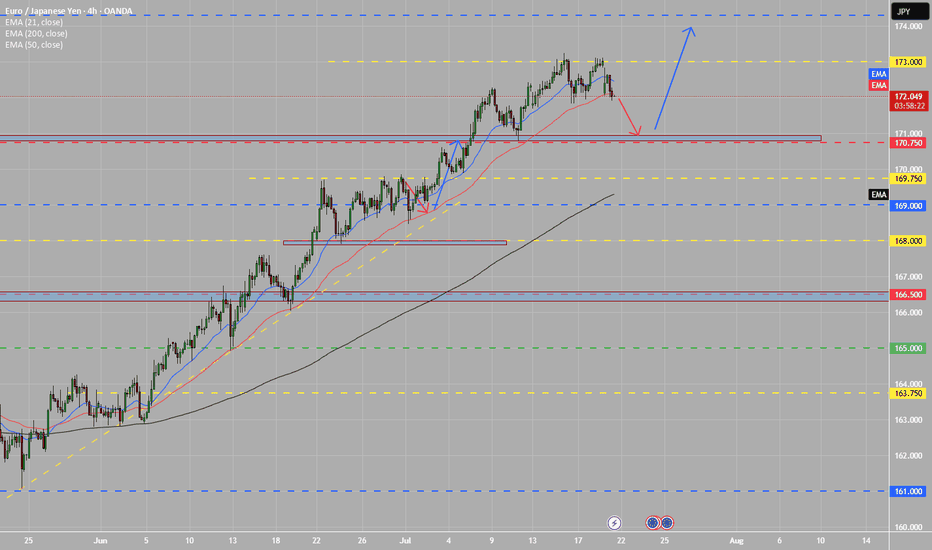
Price is settling at an all time high. Waiting to see what price action has n store for the next couple of days. We are in a bullish market at this time. A simple trade idea at this time is looking for a pullback to the monthly support before testing all time high resistance marked above in red.
Looking to see how price reacts to break of this range formed. Biased for longs.
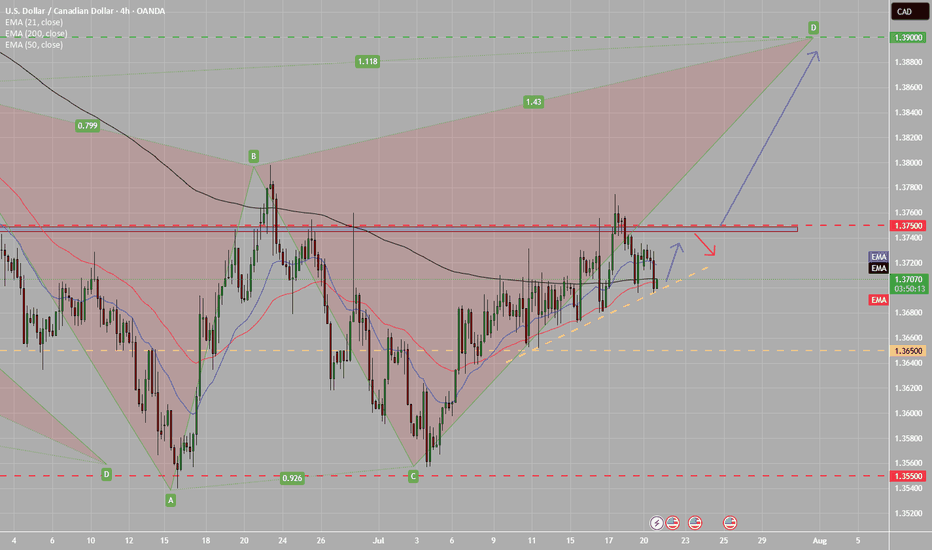
This is an inside look into the short C-D set up. Same idea keep an eye out for the price action.
Price just tested strong resistance, due to a shark harmonic pattern forming and that overall daily trend is bearish market, will favor shorts. There will be an addtional 4h look into this. Price on daily TF should not trade above C level, as long as it holds I will look for shorts.
Looking to see how price reacts to this recent bearish rally, trend is biased for shorts. However, we can possible start to see price climb, I have a target in mind which is the green resistance (weekly) would like to see break and retest of the Daily (red line) before price continues to the mentioned target.
Looking for price to hold support. Biased for longs. If price holds support we can continue to see hike until 1.7800
Have been looking at price action, if price follow shown trading path, I will enter some bearish positions on the pair at said and marked level on chart. We could TP1, should you hold, take partial and ride until next level of support.
Price seems to be reaching the 88.8 FIB Level, this would cause major resistance to bullish trend, could possible start to see price retest lower support levels.
Looking to see price pullback from highly bullish gold market. We could see a touch on daily support highlighted. This would be our bearish market. Keep in mind gold is always a long term buy.
Strong support @92.00, if price breaks below mentioned level and breaks bullish 4h trendline, it would validate a move towards monthly support. As long a C leg resistance holds strong I will only be looking for shorts.
Just an updated look on price action for this pair. Waiting on price to close below support to start looking for shorts. If this does not happen we will begin looking for longs. Lets see how this plays out.
Price has been trading around a range for the last couple of weeks. Waiting on a breakout to see where possible next levels of Support/resistance might print out. Biased on a LL, favoring a Bearish breakout. But, as it can be seen on the the chart price holds support strong. Lets wait and see wait this trade bring in for us.
Closer look into the price action. Bulls in favor as long as support stands strong, as mentioned on previous post. 4H bullish trendline along side a Daily support. If price break below will favor Bears. However overall trend on Higher timeframes is bulls market.
Price seems to be testing Daily support. Will be favoring bulls over bears. Additionally will post 4h chart to monitor price action. As long as support stands strong bulls will be favored.


