Jun-GoldAnalyst
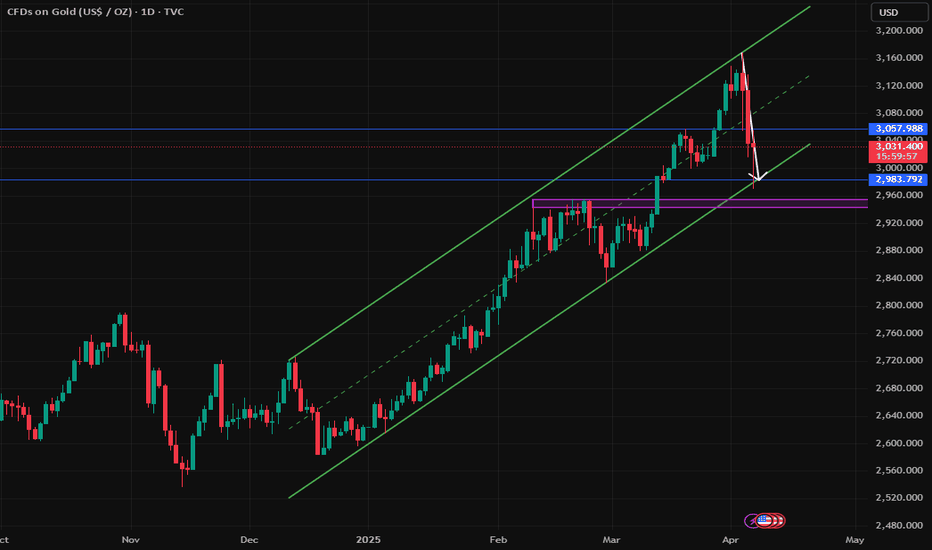
PremiumAfter the tariff policy was implemented, gold was sold off in the market on Friday. Gold was under pressure from the upper track of the rising channel trend line at 3160/3165. At present, the correction is gradually approaching the lower track of the rising channel. The daily line fell sharply and closed. The New York closing broke through the MA10 daily moving...
The central bank's continued gold purchases, rising risk aversion and relatively low real interest rates will continue to attract funds into the precious metals market. Gold prices fell on a new profit-taking as traders chose to cash out before the release of the crucial US NFP employment data. Given the increased risk of recession, the NFP data will help provide...
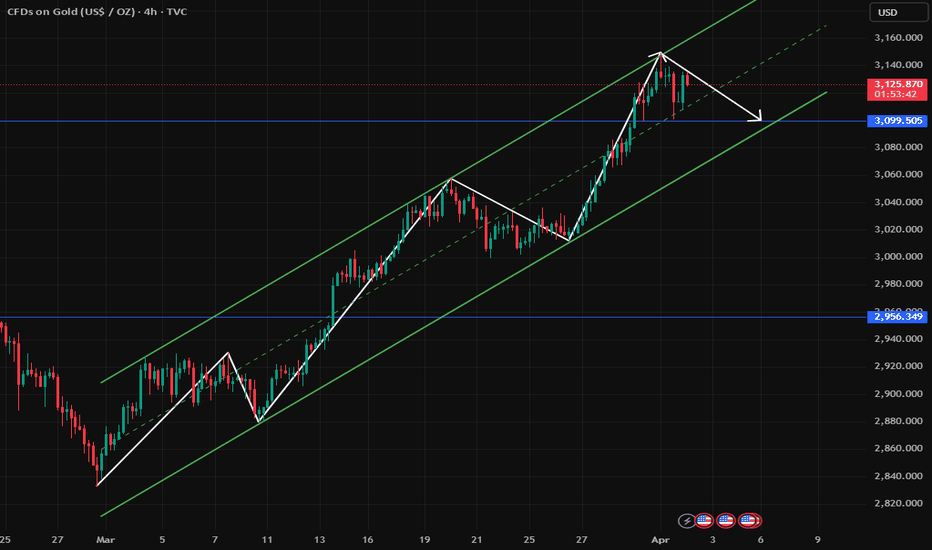
On the daily chart, gold started the downward adjustment mode on Tuesday, breaking the previous continuous rise in one fell swoop. However, the current moving average system still maintains an upward divergent shape. The 4-hour chart of gold maintains a high range of fluctuations. At present, the short-term moving average is basically in a state of adhesion and...
Gold ended its continuous rise. The daily chart was blocked and fell back, falling to 3100. Technically, the gold price is still above 3078/3095 of MA7 and 5-day moving average. At the same time, MA10/7-day moving average still remains open upward, and the price is running on the upper track of the Bollinger Band. The short-term four-hour moving average narrowed,...
Technically, the gold daily chart remains strong and hits a new record high to close. The price continues to run above MA10 and 5 days. The daily moving average keeps opening upward, and the bulls usher in a second large-scale rise. The short-term four-hour chart Bollinger band opens upward, the price runs along the upper track of the Bollinger band, the...
Technically, the gold daily chart rose slightly yesterday, and the price closed within the range of MA10-7-day moving average. The Bollinger Bands of the 1-hour chart and the 4-hour chart have narrowed, and the price is now adjusted near the middle track of the Bollinger Band! The upper track of the four-hour chart suppresses the 3038 line, the lower track...
Gold continued to fall on the daily line, bottomed out and rebounded on Friday. After a sharp retracement of the 3000 mark, the gold price closed above 3020. The daily closing price was still above the MA10/7-day moving average, and the RSI indicator was running at a high value of 70. As of now, the MA10/7-day moving average still remains upward, at 3023/3000...
Continue to buy today, rely on the 5-day moving average to enter the market, and rely on the 10-day moving average to continue to be bullish at the extreme position. From the perspective of the morphological structure, the upper trend line pressure is around 3036, and the 4-hour level market is consolidating at a high level! The high point of the daily chart...
Spot gold fluctuated in a narrow range in early Asian trading on Monday, currently trading around $2,911 per ounce. Gold prices had fluctuated at high levels for three consecutive trading days, but still rose 1.85% on a weekly basis, helped by safe-haven inflows and a U.S. jobs report showing lower-than-expected job growth in February, suggesting that the Federal...
Gold has risen in the past two days due to risk aversion, reaching a high of 2927 before starting to fall, and rebounded and consolidated at 2900. If risk aversion is alleviated, then gold shorts will make a comeback. Gold rebounds below 2927 in the Asian session and continues to sell at highs. Gold rebounds above 2920 and can continue to short. Gold's 1-hour...
Gold ended its 9-day winning streak on the weekly chart. The weekly chart fell sharply for the first time since December. The retracement tested the MA5/7-day moving average, and the RSI indicator Zhonghui's central axis value was 50. The daily chart adjusted downward for four consecutive trading days. The MA10/7-day moving average formed a high of 2916 and opened...
Gold bottomed out and rebounded in the late trading, and the long and short cycles repeated. From the daily level, the technical indicators of the gold market showed a clear divergence and were in a serious overbought range. According to the principles of technical analysis, there is a strong demand for adjustment in the market. Against this background, the price...
Gold fell below the MA10-day moving average at 2923 for the first time since January 6. The gold price in the NY market plunged sharply, hitting a low of 2988 and closing with a big negative on the daily line. Currently, the gold price is running below the MA10/7-day moving average at 2923/2930. Although the price broke through the 10-day moving average for the...
Gold continues to maintain a wide range of high-level fluctuations. After setting a new high of 2956 yesterday, the NY market fell sharply to around 2930, and then rose strongly again in the late trading, bottoming out and rebounding in the fluctuation range. The price is still running in a bullish trend structure. Today, the Asian session will first look at the...
Gold has risen for 8 consecutive weeks. According to the time period calculation, it has reached the key time window. In the general upward trend, 7-9 consecutive rises are regarded as a turning point in the medium and short cycle (changing time window). Therefore, the upward space of this round of bullish trend is gradually compressed. Entering the end, the daily...
In the early Asian session on Thursday, gold fluctuated in a narrow range, and the current price is around 2943. After setting a new record on Wednesday, it fell back. Although US President Trump's latest tariff threat made investors nervous, the US dollar continued to rebound, prompting some longs to take profits. The minutes of the Federal Reserve meeting...
Gold's daily surge hit the previous high again. After the previous M-top was formed, it retreated and tested the MA10-day moving average at 2877, then stopped at the 7/10-day moving average and continued to open upward. The RSI indicator continued to run above the high of 70, and the daily price structure was running in the bullish trend channel! The short-term...
Affected by the holiday in the USA, the gold price fluctuated in a narrow range yesterday, with a slight increase on the daily line. The overall trend is in line with our expectations. The price failed to form an effective continuation after the decline. After rising to 2940 last week, it encountered secondary suppression and then fell sharply. This week, the...


