Justfxtrades
chart shows a potential buy setup after a pullback. Price found support around 1.5350, which lines up with key Fibonacci levels, making it a strong area for a possible bounce. Buyers have stepped in, pushing the price back above 1.5500. The idea here is to target 1.5850 while keeping a stop loss below 1.5350. As long as price stays above 1.5500, the bullish...
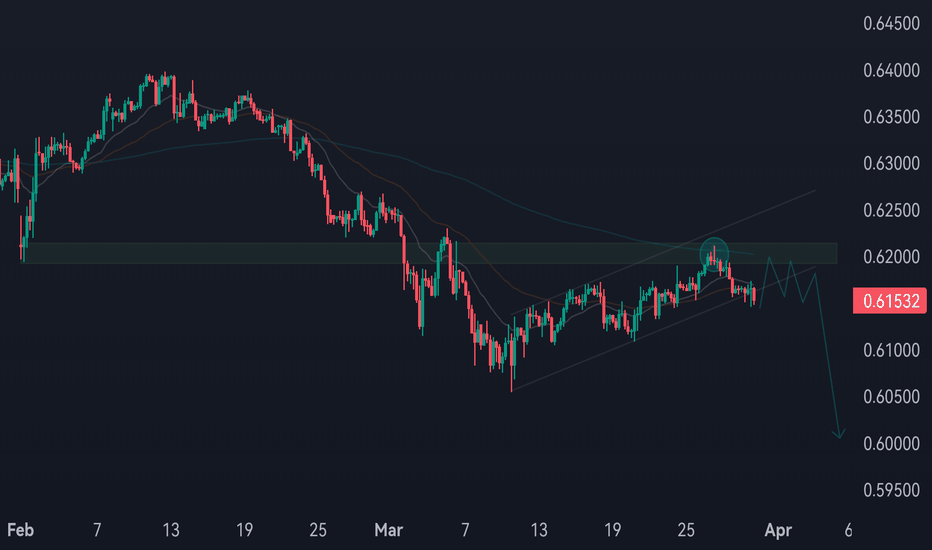
The pair attempted to break above the 0.6200 resistance zone but failed, forming a rejection. This suggests potential bearish momentum ahead. Market Structure: Still bearish overall, despite a short-term ascending channel. Bearish Scenario: If price respects the 0.6200 resistance and breaks below the ascending channel, it could head towards 0.6000 as the next...
The pair is in a clear downtrend, trading below the moving averages and facing strong resistance around 0.8859. The price attempted to break this level but failed, reinforcing the likelihood of continued downside movement. Expected Scenario: Further bearish continuation after this rejection, targeting 0.8660 as a potential support zone. Bearish Confirmation...
GBPAUD is trading inside an ascending parallel channel, the price action shows a neutral short term trend, but the major trend is bullish, price is clearly trading above the 200 EMA, my setup is wait for price to touch resistance line of the channel to catch the next correction, let me know in the comments bellow what do you think for this pair, your thoughts is...
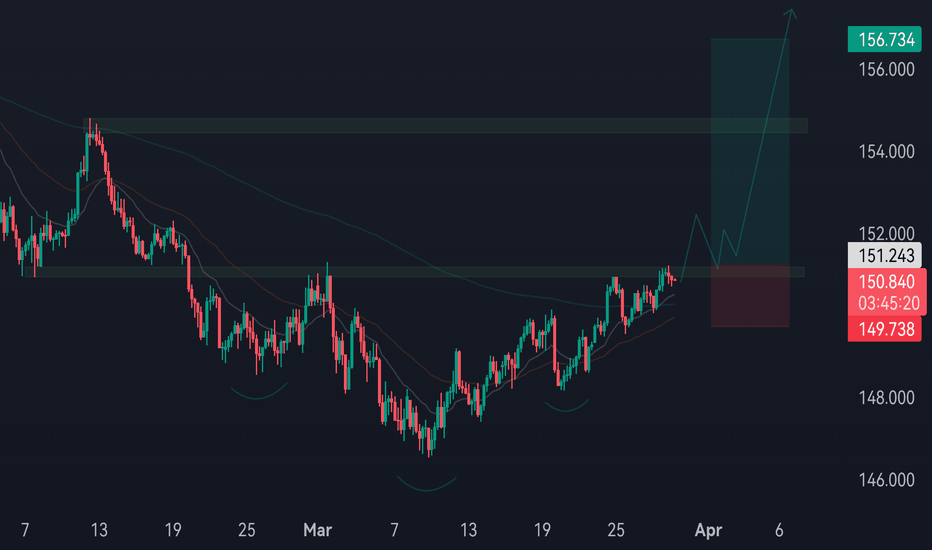
The USDJPY pair on the 4H timeframe is forming a bullish structure, showing signs of continuation to the upside. The price is currently trading above key moving averages and consolidating near a resistance-turned-support zone, indicating potential bullish momentum. Additionally, the formation resembles an inverse head and shoulders pattern, a strong bullish...
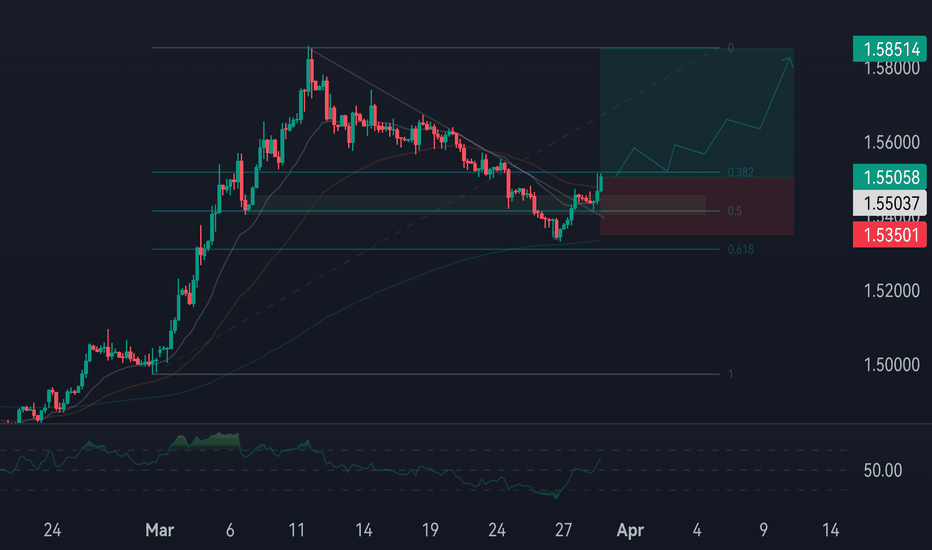
The EURNZD pair is currently breaking out of a descending trendline on the 4H timeframe, signaling a potential shift in momentum. The price has recently bounced from a key demand zone, aligning with the 38.2% Fibonacci retracement level, suggesting strong bullish interest. Additionally, the price is now trading above key moving averages, reinforcing the bullish...
Price is trading inside a falling wedge before tested a significant demand zone, price currently in a strong uptrend, if price manage to break the wedge, it would be a signal confirmation for a long scenario.
The New Zealand Dollar is consolidating, lacking clear directional momentum. However, the short-term outlook appears bearish following a confirmed closure below a key structure zone. A break below the 0.5710 level could serve as confirmation for further downside continuation, signaling potential bearish momentum ahead.
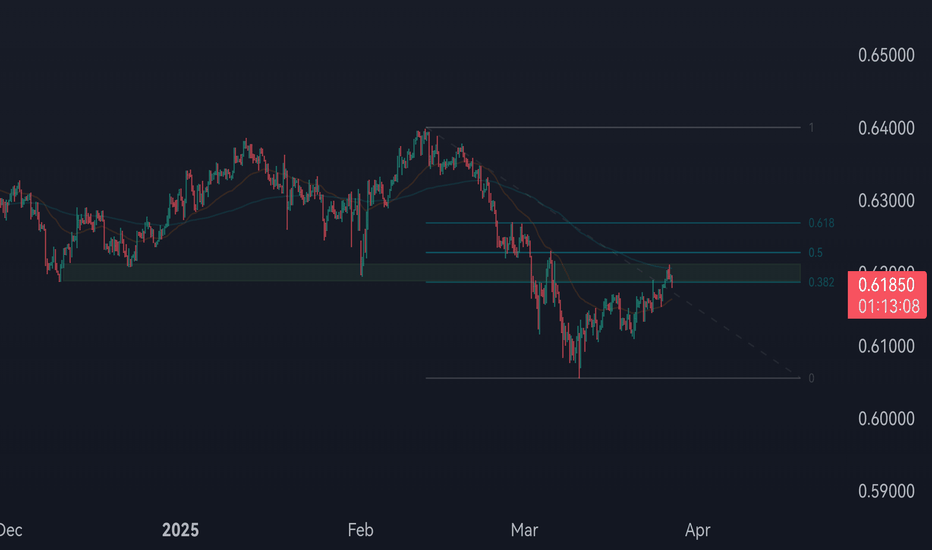
The price is currently in a strong position, retesting a key resistance zone, which aligns with the 50% Fibonacci retracement level. Additionally, the 200 EMA is acting as dynamic resistance, reinforcing the bearish bias. Given these confluences, a downside move is anticipated, in line with the prevailing trend.
price declined from a supply zone and made a made a clean break and retest on the structure zone, by looking at EMAs (21,50 and 200) we can clearly see that price has broke through them with a strong bearish candle, and currently price is trading below moving averages indicating a bearish control in the market, I expect price to continue down
it is a shiny year for gold so far, it kept reaching new all time highs since Trump declare tarrifs on canada, Mexico and china, that causes big demand on gold admit world war trade fears, we have also the geopolitical side while Israel resumes war on Palestine after months, my setup is wait for a pullback on last structure zone confirmed by Fibo, then it would be...
price is on an uptrend, after testing last resistance zone with 50% Fibonacci level price has confirmed my scenario to go long after break and retest a minor structure, entry would've been more precise on the 200 moving average touch, but that was missed and price give me another good sniper entry after retest, and I expect bullish run
On technicals, The price reacted to the bearish cypher pattern and started dropping, breaking the support level with a strong candle. It seems likely to continue its decline toward the 166 level. Right now, we’re waiting for a retest of the broken 172 support, which could be a good entry point. On the fundamental side, Swiss GDP dropped by 0.4% in the third...
USDCAD price is still testing resistance for the third time and failed to break it up, the price now is forming a triple top pattern following by bearish candle, the seller are already showing their presence, my forecast is the price will continue down until level 1.3900
Even with the Fed cutting interest rates this month, the dollar continues to rally, reaching positive levels. From a technical perspective, the USD/CHF is moving in an upward trend within a rising channel. Currently, the price has broken through the resistance level of 0.8912 and is now retesting this level after the market opened with a price gap. The price is...
Currently the price is on a downtrend, forming a bullish butterfly harmonic pattern following by AB=CD pattern, waiting for the price to arrive to our demand zone and confirm the patterns then we must look for a long position, all eyes on the AUD CPI data next week.
Currently the price is on a downtrend, forming a bullish butterfly harmonic pattern following by AB=CD pattern, waiting for the price to arrive to our demand zone and confirm the patterns then we must look for a long position, all eyes on the AUD CPI data next week.
Gold is still moving in an upward trend despite breaking the trend line, which turned out to be a fake out. It is expected to continue its rally and break its ATH amid ongoing geopolitical tensions in the Middle East and especially the escalation between Ukraine and Russia following Washington’s approval for Kyiv to use long range missiles.
