KINGIBRAHIM1981
Wild Wild Wild, let's see price from hereto form a new high
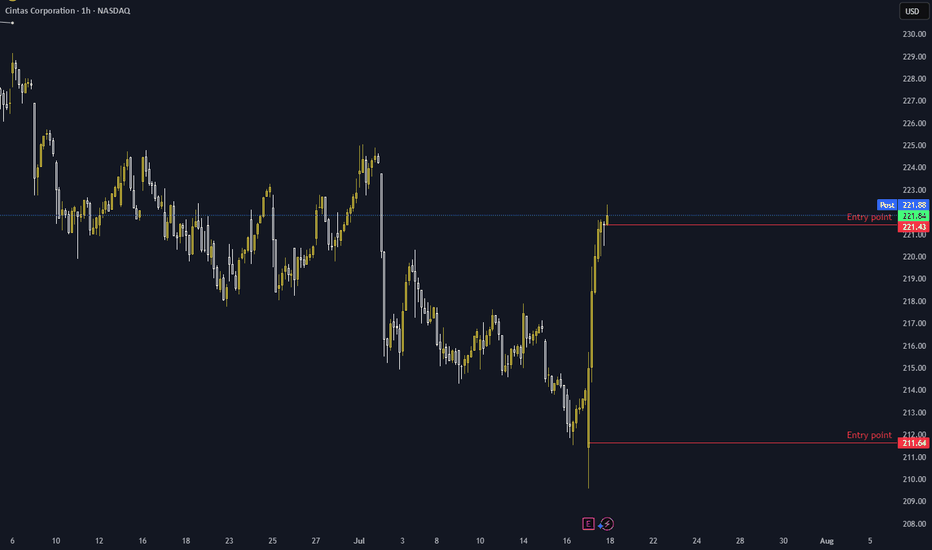
I see a good confirmation for a bullish move to form a new high. 2 entry points with SL under last low. Not a financial advice. tell me your thoughts
possible entry covering the green rectangle. i see a new high but price do whatever it likes and may fail. so, as usual it's NOT a financial advice. I share my thoughts, hope to hear from you. Auf Wiedersehen!
I see a continuation after the correction. better wait ofcourse to breakout latest high but +ve price action is clear. to the moon 5$. caution, it's not a financial advice
For me it's confirmed, entry ,TPs are shown on chart, not a financial advice
Bullish move with breakout of neckline, it may have retested the neckline or will test again. but now or wait for entry confirmation at shown level. Not a financial advice. Share your thoughts with me
1:2 RR, good set up to form a new high. 1st TP is shown, 2nd TP is the old high
we need a price action with good volume bouncing up from 0.95 $ to get RR 1:5 the OB is weekly one (has 1 touch) and downgraded to daily (fresh). your thoughts are so much welcomed by me
New setup for long trade, all numbers are shown on chart, share your thoughts. this isnot a financial advice
Good setup for buy and all numbers on the chart. give me your thoughts
Bullish set up , all info are shown on the chart. not a financial advice . Just a personal POV. Share your thoughts please
Hello Again, entered long for Compass Inc. with shown entry, SL and TP1 and TP2 points. I see daily candle confirmation. along with expected incoming interest rate variation, I expect booming. Let's us. Compare my analysis to yours and take it on your own responsibility. As usual, this is not a financial advice. Give me your thoughts!
bouncing from lvl 30 RSI with divergence on 4 hr time frame, I see bullish confirmed set up for me after bouncing from daily POI, SL and target are shown on chart
Compare your analysis with mine, first but is now, second buy is shown but SL for each trad eis shown
chart is grabbing liquidity from shown buy limit level to go up, let's goooooooooooooo
who agrees? i expected this trade as TP 1 and this up after some retracement
as of 1 hr frame, to give a bullish movement and then continue downward trend to green line then we would check for some price action
Entry is late somehow, trend is going down but it's is a chance to collect liquidity to resume going down.... BUT as always price do whatever it likes and may go down and hit the stop. share your thoughts


