KUVERA-PNV1
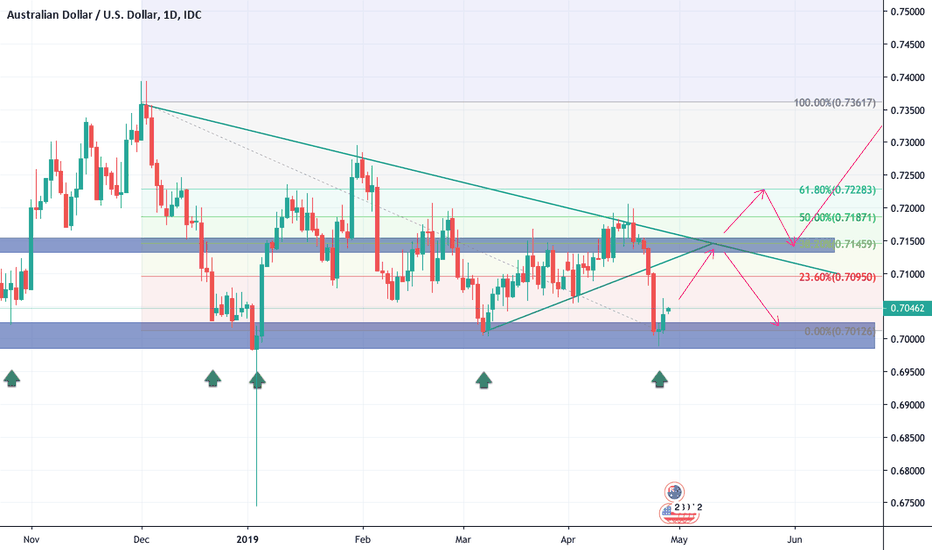
Weekly support Trendline breakout H4/D1, should retest STOCHASTIC / RSI OVERSOLD Daily wicks rejections Should up now till next resistance, retest trendline and reach 38.2 fibonacci level at 0.71300.
Weekly resistance Daily trendline 61.8 fibonacci STOCHASTIC / RSI OVERBOUGHT Should go down now.
Trendline D1 Daily down trend Resistance D1 61.8 Fibonacci OVERBOUGHT H1-H4-D1
D1 support Trendline H1 + D1 50.00 Fibonacci level
STRONG W1 Support W1 trendline H4 OVERBOUGHT RSI/STOCHASTIC
Daily resistance at 111.000 H4 Trendline 61.8 Fibonacci STOCHASTIC / RSI OVERBOUHT
Strong support W1 Trendline D1 61.8 Fibonacci STOCHASTIC/RSI OVERSOLD
H1-H4 support breakout Triangle breakout downside 23.60 Fibonacci after retest.
Strong W1 resistance Trendline W1 RSI / STOCHASTIC OVERBOUGHT
Trendline H4 Support H4 at 1.13500 61.8 Fibonacci 1.13500 Pivot point at 1.13510 Oversold RSI H1/H4
Breakout trendline Resistance H4 at 0.99700 61.8 Fibo at 0.99700 RSI Overbought coming ( as confirmation ) Daily Pivot point at 0.99580 Should come back test the trenndline and then need watch out for a possible rebond.
Bullish trend Support H4 Trendline 50.00 Fibonacci Oversold RSI M30-H1
Bearish Trend H4 strong resistance Trendline 50.00 Fibonacci
Resistance Weekly W1. Overbought RSI D1. 61.8 FIbonnaci. Possible pull back to 1265-1275 then will up to 1300+.
Trendline D1. Weekly resistance. 61.8 Fibonacci. We should get a reverse soon.
Possible turnaround for USDCAD Will up till 1.34200, 1.34500 or 1.35000 ( watch out resistances ) Also 50.0 Fibonacci level. Then will go down and possibly turnaround till 1.31500 ( around 150-250 pips goal ).


