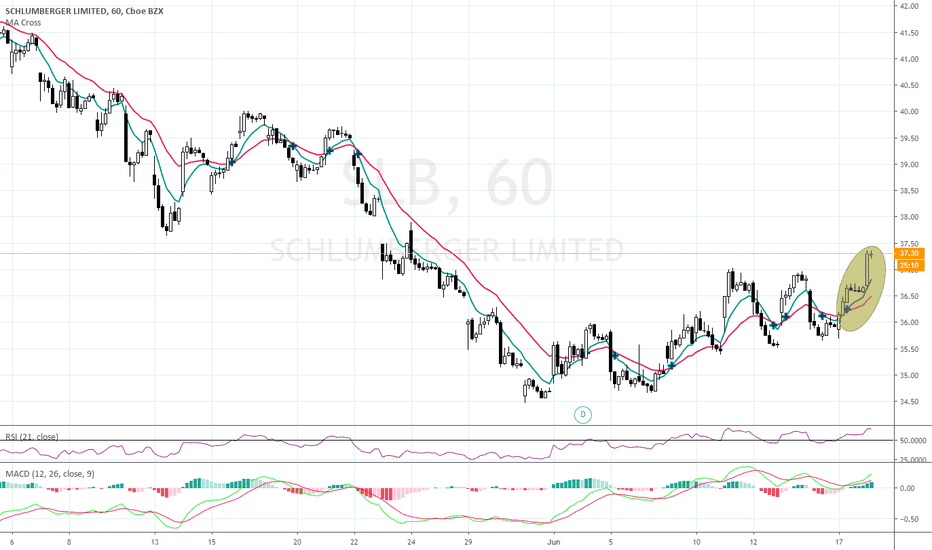
Multi-time frame analysis shows this to be a snap back into greater trend
MFA shows the hourly chart sbanapping back into larger trend
Multi-Frame Analysis indicates a reversal to upwards push showing itself at moment.
Coupled with crossing of 8, 21 EMA and the downtrend of the 200 EMA, Plus weakening of the 21 RSI
Multiple indicators showing strong beginnings of bullish run
MTFs plus hitting lower zones in MACD and lowered EMA cross over.
MACD crossing down in under zero line, EMA cross over and long down channeling
MACD & EMA crossing over at same time, relevant to signal, MACD cross over taking place above zero-line.
Possible change in direction given EMA/MACD crossing over at same time with later taking place above zero-line
EMAs crossing over at exact time the MACD is doing the same, with latter taking place above zero-line
Double top; EMA and MACD crossing downwards at almost exact time; case for bears being made.
Oscillators, indicators and CMF upwards AND above mid or zero lines, where applicable
Whilst could go either way, given strength waning and MACD below zero, it may be likely a downfall soon.
Entry after MA Cross and several oscillators/indicator upward facing


