KeN-WeNzEl
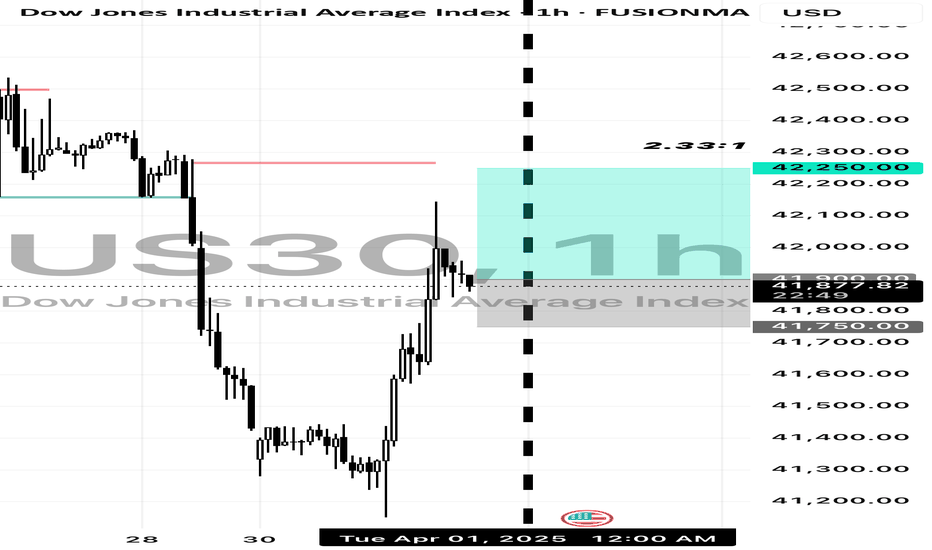
Technical Confluence: Daily Chart: • Strong bullish engulfing recovery from recent support (~37,700). • MACD starting to curl back up from deeply negative levels — possible trend reversal. • RSI recovering above 50 (currently 52.49), suggesting bullish strength resuming. 15-Min Chart: • Sustained uptrend with pullbacks respecting the moving average. • MACD...
Technical Analysis Summary Daily Chart (Macro View) • Price has bounced off a key support near 37,700 and reclaimed the psychological level 40,000. • MACD is starting to reverse higher from oversold conditions, showing early bullish divergence. • RSI is recovering from below 30, now near 49, indicating a potential trend reversal. • Trend: Medium-term recovery...
Navigating the movements of the **US30 (Dow Jones Industrial Average)** can be challenging, especially amid shifting economic policies. The Dow, which tracks 30 major U.S. companies, is highly sensitive to trade policies, corporate earnings, and geopolitical risks. Trump’s plan to impose **10% across-the-board tariffs** and **60%+ tariffs on Chinese goods** has...
Technical Justification: 1. Daily Chart: • Price has recently bounced strongly from a significant support zone around 37,675, confirming a bullish rejection. • RSI is rising from oversold levels (currently around 48), showing momentum is shifting upwards. • MACD is still negative but starting to converge, signaling a potential reversal in the mid-term. 2....
1. Technical Analysis Daily Chart • Trend: Still overall bullish long-term, but in a short-term pullback phase after peaking. • MACD: Bearish crossover with widening histogram — indicating continued downside momentum. • RSI: At 45.05 — neutral-bearish, room to fall to oversold. • Price: Strong reaction at ~37675.05 area, bounced back to ~39562, forming a...
Technical Analysis Summary: Daily Chart: • The US30 is bouncing off a recent sharp correction with a bullish engulfing candle forming at support (around 37,675). • RSI is recovering from oversold territory, now at 46.14 – momentum is shifting. • MACD still bearish but histogram is shrinking, indicating weakening downward momentum. 15-Minute Chart: • Strong...
Technical Justification: Daily Chart: • Oversold Conditions: RSI is at 35.90, approaching oversold. • MACD is deeply negative (-905.428 / -831.781), signaling extended downside and a potential for a mean reversion bounce. • Price recently bounced sharply off a support area around 37,800–38,000, forming a possible bullish rejection wick. 15-Min...
Trading indices during long weekends or bank holidays can be risky due to lower liquidity and higher volatility. Many major financial institutions and market participants are away, leading to thinner trading volumes. This can cause exaggerated price swings, making it harder to execute trades at desired levels. Additionally, unexpected news or geopolitical events...
Technical Analysis Summary: Daily Chart (Macro View): • Trend: Bearish short-term (price is below the moving average, sharp recent drop). • MACD: Bearish momentum building with a deepening histogram. • RSI: At 42.22, pointing down – no oversold condition yet, so further downside is probable. 15-Minute Chart (Mid-Term Momentum): • Trend: Recently broke down...
Technical Overview: Daily Chart: • Clear downtrend with price sharply rejecting from recent highs (~42890). • MACD shows strong bearish momentum with a widening histogram. • RSI is below 50 at ~45, confirming downside pressure. • Price has broken below a key support level near 40200, now acting as resistance. 15-Min Chart: • Recent lower highs and lower...
Technical Analysis Summary Daily Chart: • Trend: Recent strong rejection from the 36893 zone followed by a sharp V-reversal; currently recovering, but still under prior highs. • MACD: Deeply negative but showing signs of reversal (momentum slowing). • RSI: At 46.22 — mid-range, suggesting room to go higher. • Bias: Recovery from oversold — bullish short-term...
Daily Chart (Macro View): • Bearish divergence: RSI is at 47.38 and turning down — no strong bullish momentum. • Recent bounce is sharp but came after a massive drop, suggesting a dead cat bounce or retracement. • MACD remains heavily bearish (-836), showing underlying weakness despite the current bounce. • Price recently rejected a key resistance near 40,850,...
Technical Analysis Summary: Daily Chart: • Trend: Strong bearish breakdown; significant drop below support. • MACD: Deeply negative, suggesting strong bearish momentum. • RSI: Oversold at 18.48, indicating exhaustion but not yet reversal. 15-Minute Chart: • Trend: Clear downtrend continuation. • MACD: Bearish crossover sustained. • RSI: Approaching...
Daily Chart: • RSI: At 24.33, it’s in oversold territory — potential for a reversal. • MACD: Strong bearish momentum, but the histogram may be bottoming out, signaling a potential bullish divergence forming. • Price Action: Testing key support zone near 38300, which was previously a resistance-turned-support area. 15-Minute Chart: • RSI: At 60.68,...
Technical Analysis Overview: 1. Daily Chart: • The index is in a clear downtrend, with price action breaking below the moving average. • MACD is deeply negative, with a bearish divergence and downward momentum. • RSI at 37.28, indicating approaching oversold territory, but not yet reversing. 2. 15-Minute Chart: • Strong downward momentum with sharp drop...
Technical Analysis 1. Daily Chart: • Trend: The price has been in an uptrend but is showing signs of exhaustion. • MACD: Deep in negative territory (-311.308 & -377.356), confirming bearish momentum. • RSI: 44.24, indicating weak momentum and room for further downside. • Key Resistance: 42,890 • Key Support: 41,000 2. 15-Minute Chart: • Trend: The price...
Technical Analysis: 1. Daily Chart: • US30 is in a pullback phase after a strong uptrend. • The MACD is negative, but price is nearing key support, signaling a potential reversal. • The RSI is at 43.74, close to oversold territory, indicating limited downside risk. 2. 15-Minute Chart: • The MACD is strongly positive, confirming short-term bullish...
Trading the US30 (Dow Jones Industrial Average) with support and resistance is a powerful strategy, especially when the index approaches or breaks into all-time highs (ATHs). Key support levels often form at previous resistance zones, while psychological price levels (like round numbers) can act as both barriers and breakout points. When US30 reaches new ATHs,...


