KeepItsimple74
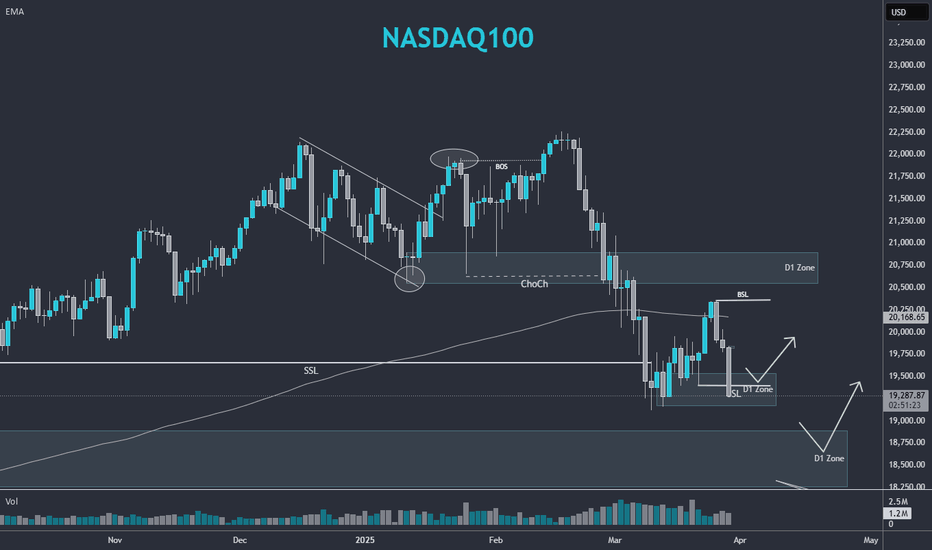
We have a reaction today after testing 18900 zone.. Let´s see what happen on April 2nd
Very bear day today! Regardless we are in a support zone, we could still see index testing lower prices. Let´s wait and see how reacts from here to take action
We saw a reveral structure confirmation few day ago, the pair were very bullish last week breaking EMA200. Now is it could be expected to look for lower zones to grap liquidity. You could dive in lower time frames if price reach the zones and look for entry setups
The pair is in a bear structure from janaury 25th, break down a D1 Zone that now become a resistance zone. I woul not look for long entries for the moment.
Gold exhibits a strong bullish trend and is currently at elevated price levels. However, the prevailing macroeconomic uncertainty aligns with investors' tendency to seek gold as a safe-haven asset. Applying fractal market analysis and projecting the initial structural development suggests a potential technical target in the $3,200 zone. Nevertheless, given gold's...
Given that the price is currently below the 200-period EMA, it is highly probable that it will attempt to retest this level. The observed structure suggests a potential reversal. Specifically, a change in structure has occurred, followed by a retest of the lower zone, a liquidity grab, and a subsequent upward movement. Currently, the price is approaching a...
Cardano reach 1.17, a price inside the D1 zone previous market as "the zone to break", but it wat no capable to do it. Now lateralizing, not clear opportunties yet to take!
I Think Gold is in a bullish structure. It is expensive at the moment, and you can see a reversal formation. Up to where is going to fall, well maybe you could use Fibo tool to give an idea. I would wait for a bullish pattern to look for longs.. the market is choppy with lot of volatility, gold would be strong on this situations.. but keep an eye on USD
We are in an important support Zone. Has not to be lost in order to keep thinking in longs!
We're currently within a broad consolidation range, with price action indicating a potential liquidity grab towards lower levels. A daily (D1) support zone has been breached, and we're observing a bearish correction channel. I'll be monitoring the next D1 support zone or the 'key liquidity area' for reversal patterns, signaling potential long opportunities. A...
Compressing price near a support Zone, would like to see a liquitidy sweep and go up!
Within the lateral channel, we are in the lower zone. It is very possible to see a test of this zone that gives us the opportunity to enter long.
Today NFP new were no good from stocks point of view. The index went down to D1 Zone. If the zone is lose, then you can see possible objetive market on the chart
Bullish scenario is doing well, my primary target was reached!
Gold is pushing up at the beginning of this new year. I see a long oppty as the price break a triangle pattern formation.
I would like to see the price in a cheaper zone befor to look buys oportunities. Be careful of de BSL ( Buy Liquidity zone)
Testing again the trend Line. Be careful of the correction channel, price could good deeper. Regarless I still in the position


