KelvinTan88
Attached is the Technicals of Apple Inc (NASDAQ: AAPL). Apple is ready to rally significantly again. It will rally along the orange channel as illustrated. The momentum are all fully geared on now
Attached is the technicals of Japanese Nikkei 225 going in sync with worldwide financial markets. Nikkei 225 represents an example of some of the weakest market in secular cycle perspective. Even the weakest economy had also broken up super-cycle resistance trend band in double black.
During this correction, volumes were low meaning the stocks were passed from the weak mental strength herd to the hands of the smart monies. In the comparison analysis, UOB outperformed the benchmark financial index, refusing any whipsaw along the way.
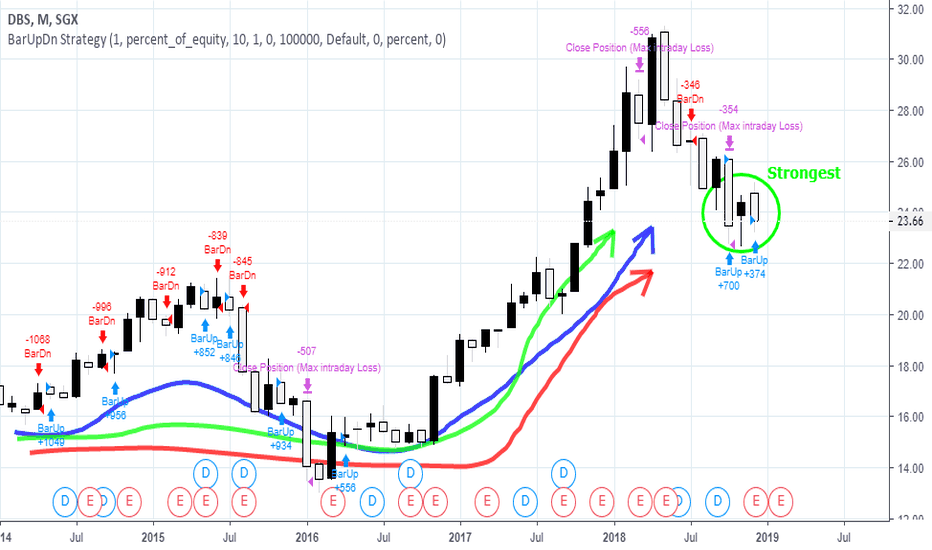
During this correction, volumes were low meaning the stocks were passed from the weak mental strength herd to the hands of the smart monies. In the comparison analysis, DBS outperformed the benchmark financial index, refusing any whipsaw along the way. ODBS only gently touched the 200EMA showing why it had been the strongest bank among the 3 local banks in...
Attached is the updated Technicals for MAYBANK -- The Donovan Norfolk Rated Top Bank of Entire Malaysia KLSE. The 3 dark green circled regions are my live calls in January 2016, 1H-2016 and 2H-2016 to buy bank stocks all over the world. Back in 2016, the herd were shouting for market crash and a bear market because the FED rate hikes caused a massive fear and...
1. As reiterated, 1st half of the bull market runs from 2008-2018 and 2nd half of bull market runs from 2018-2028. 2. Olam has consolidated in a large symmetrical triangle during the first half of the bull market from 2008 to 2018, and 2nd half of the bull market is where majority gains are to be made.
From the diagram, it can be sure 95% herd are either bearish, calling for bear market, calling recession and calling for crisis. We are in super-cycle bull market of a life time.
Attached above is the Monthly Technicals of FTSE Singapore Straits Times Index (FTSE STI). If you had been learning from my teachings all along, you will know that Singapore FTSE STI is the number 1 indicator for global economic health and worldwide financial markets. The reasons had been explained in my previous FTSE STI teachings. STI is maintained in strong...
SCGM's net profit rose 6 folds q-o-q on the back of a 16%-increase in revenue to RM56 million. When compared to same quarter last year, net profit dropped 81% while revenue rose 4%. Revenue increased q-o-q, mainly due to higher sales from local and overseas markets. PBT rose q-o-q in line with higher revenue achieved for the current quarter. PBT dropped y-o-y due...
For QE30/6/2018 (2Q2018), Kimlun’s net profit dropped 22% q-o-q or 33% y-o-y to RM10 million while revenue was mixed - dropped 1% q-o-q but rose 12% y-o-y to RM218 million. Revenue dropped 1.3% q-o-q but profit after tax dropped 22% or RM2.76 million due to sharp drop in Group’s gross profit of RM3.34 million or 12.2% due to lower gross profit margin achieved by...
Refer to each of the funds flow sequence in the timeline series illustrated on chart to see how funds outflow was executed (from the all-knowing birds, to the early birds, to the majority of the flock of birds involving the main outflow tsunami to the late birds). When majority of the flock of smart birds were outflowing as tsunami, it is obvious based on the FFA...
The 3 dark green circled regions are my live calls in January 2016, 1H-2016 and 2H-2016 to buy bank stocks all over the world. Back in 2016, the herd were shouting for market crash and a bear market because the FED rate hikes caused a massive fear and markets were selling off. Singapore was to have technical recession back in 2016 too, and I was calling for bank...
Reiterate: Public Bank is Ranked the Number 2 Top Bank of Malaysia by me Side Note: At target of $29.25, many of these early fans of mine will have returns of more than +182% profits on such quality stocks. Additional Note: Worldwide bank stocks are expected to shoot through the roof in 2H-2018 and 2019. More waves of super rally in equity markets can be...
The black arrow regions and orange circled region are regions of bargain value as determined by smart money flow. Hengyuan's current status is net funds flow inflow. Smart monies are no longer selling as net aggregate; instead, they are currently holding on secretly and staying invested in the market (bullish biased). Current point remains bargain value point....
After the first major inflow in funds flow, the stock exhibited a bearish descending triangle to help in further accumulation of the stock. The bearish descending triangle is to lead people to believe it is in distribution mode. During this time, the funds flow inflow continued to go up secretly. This followed with a breakdown of the descending triangle which...
The start of 2011 is the start of operation of using multifold gains up and -50% price shedding for an up-down-up-down momentum to shake out the market. This is a very common operation for penny stocks because of its floating volume in the market, gain/loss as a percentage and the psychology involved. In most cases, penny stocks are often the last to run in a bull...
The FFA for Eden Inc is similar to Vivocom International. The only difference separating Eden and Vivocom is that the time may be ripe for Eden to either change its fundamentals or be in line with new theme of play. When the time is ripe (e.g. change in forward fundamentals or change in theme), stocks penny in status and with long term funds inflow will often...


