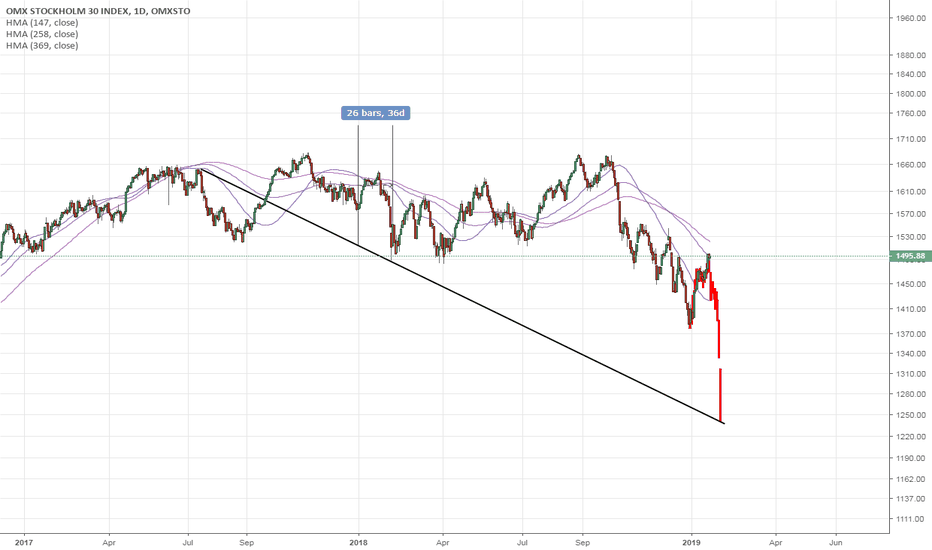
Fractal copied from the period 2018-01-02 - 2018-02-06
Fractal copied from the period 2017-12-12 - 2018-02-09
Last time we had a move like this was almost 1 year ago in February 2018 right after the Super Blood Moon Eclipse on January 31st, that is the fractal that is being copied here from the period 2018-01-02 - 2018-02-07 and the move started right after the Super Blood Moon. We now have the new eclipse on 2019-01-21 and the markets are expected to move down like last...
A triangle formation is now complete on the 3H time frame which will cause the index to drop over the next 3 days.
Current fractal tracking on the Japaense index NIKKEI225 on the 4H time frame readjusted.
Current fractal tracking on the Japaense index NIKKEI225 on the 4H time frame.
Bearish Fractal that has been forming since December 2018 with overbought RSI it is now ready to move lower towards 1260 and the 2019-01-21 low-point.
The market has now reached a recent top with the current fractal and is now headed towards the next low-point on 2019-01-21 which coincides with the Super Blood Wolf Moon on the same date (Moon Phase) which means we will make a major low around that date.
Below the Red Line and the market moves towards the 1800 level fast, buyers lose control over the price when it trades below the Red Line.
Technical pattern on the Monthly chart.
This is the main idea of the final wave for DAX30 and the indices similar to it based on the 90-year cycle from 1929 (Great Depression) + 90 years = 2019 90 years as in 90°down in the markets. The 90-year cycle is also the 90-year debt cycle. The 90-year cycle is one of the most powerful cycles out there and it causes huge drops as DAX30 and other indices...
This is the real market risk, the most obvious contagion to date that will most likely cause the next financial crisis because of the amount of debt that the bank holds within the banking system when this stock moves down the market also follows. Technically below that trendline and Deutsche Bank moves towards default and 0.11€
A long-term Head and Shoulders Pattern is completing on Weekly and it is targeting 11400 levels and 10938 at first hand but then 10400 when $VIX gains strong momentum soon during this period. Time will tell how deep it falls.
If red bar below green renko bar then I am expecting DAX to trade towards 10938. This scenario is only valid if we form a red bar below the green one now.


