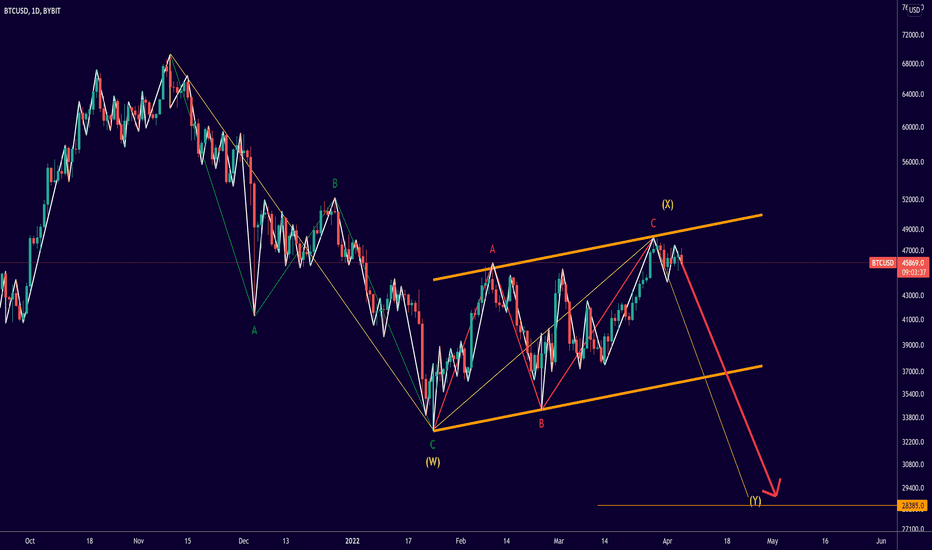
Given that the price fell from the 69000 peak in three waves, we are probably currently facing a FLAG correction of the price, which can be considered as an X-wave and can be expected to start from the range of 47000 to 49000. Other than that, its targets can be in the range below $ 32,000.
Considering the downtrend and alignment with the important Fibonacci range, the resistance range is $ 139 to $ 161 in front of Solana. Solana probably does not have the strength to break this resistance range and the price starts to fall to one of the $ 118-80-58 supports.
#BITCOIN #BTCUSD DAILY CHART ELLIOTT ANALYSIS Given that the price fell from the 69000 peak in three waves, we are probably currently facing a triangular correction of the price, which can be considered as an X-wave and can be expected to start from the range of 42000 to 44000. Other than that, its targets can be in the range below $ 32,000. If the price rises...
Given the downtrend shown in the image, as well as the Elliott wave count, we will probably have another uptrend to the range of 41,000 to 43,500, and then in that range we will see a weak uptrend and then the continuation of the downtrend to reach lower targets. From $ 34,500.
Given the formation of the ABCD pattern in a correction channel, there is a possibility of a price drop, at least to the bottom of the pattern.
Due to the Elliott wave count and the formation of a diagonal ending in the C-wave, we are expected to see a drop in price from $ 3,000 to $ 3,220 to $ 2,000 to $ 1,700.
Given the wave count, it is likely that we are completing one of three ABC correction waves. If this is true, it can be expected that bitcoin will temporarily continue to rise to the $ 44,800- $ 45,800 range, and from there the price will continue to fall again.
See the pattern of the DOUBLE BOTTOM on the USDT.D chart. Given the Fibonacci targets of this pattern, as well as the breaking of the neckline and pullback to it, the ascent is expected to occur, at least up to the 4.8-5.5 range.
#TOTAL CRYPTO MARKETCAP HEAD AND SHOULDERS In case of breaking the neckline The probability of decline is at least up to the range of 1.7 to 1.4 billion.
Given the formation of the wedge pattern and the exit of the descending channel ceiling, it is likely that the price will rise in the form of the ABC Elliott pattern. ENTRY: 210-200$ TARGETS: 239$ 249$ 259$ STOPLOSS: 190$
According to the wave counts, it seems that we are facing a flat pattern and we can expect the price to continue to fall from $ 31 to $ 29,000 to complete wave C, and in the meantime, the $ 43,000 support is very important. If the $ 29,000 support is broken due to unforeseen events, a much sharper fall will follow.
Considering the opening triangle pattern as well as the Elliott wave count and the 2-4 trend line, one can expect price support in the range of $ 640 to $ 630. If this support occurs, the price will likely rise to one of the following targets. TARGET1: 690 TARGET2: 740 TARGET3: 790 STOP LOSS: 590 TIME: 4D-2W
Considering the orange and purple uptrend channel and the fact that the price has supported its uptrend line, as well as the formation of a triangular pattern, we can expect the price to grow to one of the following targets. TARGET1: 100$ TARGET2: 140$ TARGET3: 170$ Due to the strong resistance on the first target, if the price reaches this target, save profit...
Given the uptrend channel and the triangular pattern that forms after a strong uptrend and can be very similar to the flag pattern, it is likely that we will soon see the exit of the triangle from the ceiling. If this happens, the targets are: target1: 1.9$ target2: 2.4$ target3: 2.9$ stop loss: 0.88$ entry: 1.19-1.05 time: 2-8W
Given the uptrend channels and approaching one of the important support levels, as well as the formation of a triangle-like pattern, one can expect the price to rise. The Targets of this ascent achieved with Fibonacci clusters are: target1: 1.1$ target2: 1.35 target3: 1.75 stop loss: 0.63 entry: 0.82-0.72 time: 1-5W
Due to the long-term uptrend channel and the formation of the triangle pattern, as well as approaching one of the levels of the uptrend channel, due to the help of Fibonacci, there is an expectation of price growth to one of the following TARGETS. TARGET1: 165 TARGET2: 188 TARGET3: 210 STOPLOSS: 110$ ENTRY : 128-122 TIME: 1-3W
#Automata_Network #ATA 4H TECHNICAL ANALYSIS Given the trend lines, the drawn channels as well as the Fibonacci levels, the support price is expected to be in the range of $ 0.83 to $ 0.67 and lead to a price rise. In this case, the expected targets are: target1: 1.2$ target2: 1.4$ target3: 1.6$ stop loss: 0.589 entry: 0.83-0.67$ step by step
#DODO DAILY CHART TECHNICAL ANALYSIS Given the channels and trend lines drawn, the price seems to be breaking the orange trend line. Accordingly, it is expected that if the orange trend line is validly broken, one of the following will continue. TARGET1: 2.2$ TARGET2: 3.2$ TARGET3: 5.2$ STOP LOSS: 0.99 ENTRY: 1.62- 1.3 STEP BY STEP TIME: 3-8w


