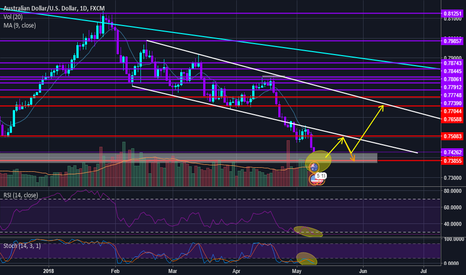
Trade had broke the resistance which then became the new support and then retested it. It since then started rising I believe the trade will go up towards the trendline area, which I personally set take profit. The next decision happens from around that area whether it will break or respect. If it breaks the trendline and closes above then I believe that it...
The trade has recently broke the resistance (now the new support) and then then tested the new support. Now currently rising I think the trade will go up to the trendline which it has respected in the past and then the next decision is from there. If it breaks the trendline and closes above it could possibly go higher to next key area but if it doesn't and...
Look at chart to see description of what's happening
My thoughts on two alternate ideas: IDEA 1 - If it breaks the support zone and the trendline it would go lower to the next zone which is either at the 38.2% or around the 61.8% on fibs (that's more long term those levels as I did the fibs a bit wider, however even if I did a smaller fibs the zones I drew out will still be around key levels). IDEA 2. If it...
Looks to me that the GBPJPY will struggle around the resistance heavily as it has tested it multiple times already and hasn't broken through in the past. Who knows though maybe it will, you can never know? However more likely a sell looks more like a viable option, dropping heavily all the way to the 61.8% on the Fibonnaci which is a key support zone also. On the...
EURUSD is heading down towards the weekly support at around 1.16414 then I expect that it would then go back up towards 1.20850 and could then either form a head and shoulders pattern or could go over and continue to go up towards the weekly resistance area at 1.25701. Looking at the indicators such as the RSI and Stochastic also on the Weekly chart, the Rsi...
AUDUSD looks like it may get in the region between 0.74190 and 0.73731, and then shoot up. Last time it was in that region was May last year. FOR EXTRA CONFIRMATION: Note on the D1 chart the rsi is currently below 30 and the stochastic is below 20. On the weekly chart it shows it still has room to move but I believe it will also go below 30 on rsi and 20 on...


