LD_Perspectives
1. Parabolic Advance from 03-Oct to Present 2. Price testing/nearing swing resistance 3. RSI in Overbought Territory 4. Candle structure on lower time frames (esp 2 and 4-hour reflecting selling pressure). Looking for a pullback to the 1.3400 level. Now 1.3613. Stop: 1.3720
Copper To Follow The Aussie? This morning we saw a contraction in the Caixin PMI out of China (49.7 vs 50.1 forecast), with the Australian Dollar moving lower, as a proxy for Chinese growth. Since February 2018 we have seen base metals under pressure, with Copper now triggering a multi-year bear flag formation (Watch out Anglo and Billiton). On a multi-year...
I have been bearish on SA Retailers since March 2018 (short/sell idea on TFG since R220) - this was when we saw 'Peak Ramaphoria' and when the Rand traded around 11.55 to the USD. From a valuation perspective, SA retailers do not trade on the value side and should we see weak retail Festive Season Sales being reported, this could be a catalyst for a further...
Type: Call Premium (Ask): $0.34 Expiry: 15 Feb 2019 Strike: $7.00 Current Level: $5.68 NYSE:SNAP
Despite most global markets experiencing declines for 2018, the long term setups show indices barely off their All Time Highs. E.g. Hang Seng HSI:HSI -22% off it's ATH, forming a double top and testing a 32-year trend line. A look at the chart sees the 200-month MA (currently 20% lower) providing support. Will we see a testing of this level once again?
Level: 1.1458 SL: 1.1495 TP: 1.1390
Entry : 1.1433 TP: 1.1413 SL: 1.1447
Dear Trader Investing and trading offshore allows market participants to access industries and sectors not necessarily available on the JSE. Today's trade idea illustrates that with the share being luxury car manufacturer Ferrari NV whose share price has been under pressure since mid-year amid late-CEO Sergio Marchionne stepping down due to health concerns, a...
Rinse and repeat? Potential short setup on USDCHF. FX:USDCHF Trade levels: Short at current levels: 0.9921 Stop-loss: 1.0025 Take profit target: 0.9640
Facebook short/sell setup. Daily chart running into 50sma resistance. 15-min chart setting up a 2x top pattern with 2nd incline support being breached. Good run from $129, I think time for a pullback. Now $145.53. SL: $148 TP: $137
I've always viewed Richemont as a bull market stock. What do I mean? Well, when the ultra-wealthy look at their portfolio and see green, what better way is there to spend those after-tax gains on a fancy piece of jewelry? Similarly, red on their screen could see them refrain from stepping out and making a luxury purchase. This is where luxury stocks fit in. Over...
Potential Buy/Long Setup on JSE:QLT driven by these key factors: - Price support seen at 20.32 and 20.50 - Prior bullish turns on Money Flow Index accompanied by rising price while bearish turns has seen the price move lower. See chart marked 1,2 and 3 (bullish turns) as well A and B (bearish turns). - Stochastic Bullish Divergence -...
A share's prior breakdown level often becomes a distribution zone once the level is re-test. Spar Group, which has rallied back to this level, is also testing it's downward trend line resistance while the last three sessions, by observation of the candle structure suggests 198/202 becoming a distribution zone. while the volume is starting to decline on this 4-day...
Key Technical Drivers - Volume has declined on the 2nd push higher - Potential channel breakdown - Trading at overhead resistance - Price trading 40% above it's 200dma Suggested levels: Short @ market 3247c TP: 2900c (blue dotted line) SL: 3460c In addition, the platinum price is playing out from a bear flag pattern.
SA GDP release due at 11:30am today. With the exception of ABSA’s Manufacturing PMI, the recent economic data points have been below well below expectations. Should we see a continuation of this negative trend, this could reverse the recent ZAR strength. On the chart: Accumulation is 13.57/13.60. Resistance 13.92/13.88. Intraday a break above 13.70 (could take...
Traders can look to have another go (short) at the sportswear giant. Technically, we have the price testing the downward trend line resistance, with 207 being a significant breakdown level. Short at current price: 206.90 SL: 211 TP: 196
The share trades just above it's 200dma, having rebounded from it's mid-October lows. At at current levels, we also have a bear flag formation that has been built, with the current level being the 5th test of the lower boundary of the channel. Upon a break of the trend line, I am looking for a move back to the mid-October lows of 74.84, using a SL of $87.30.
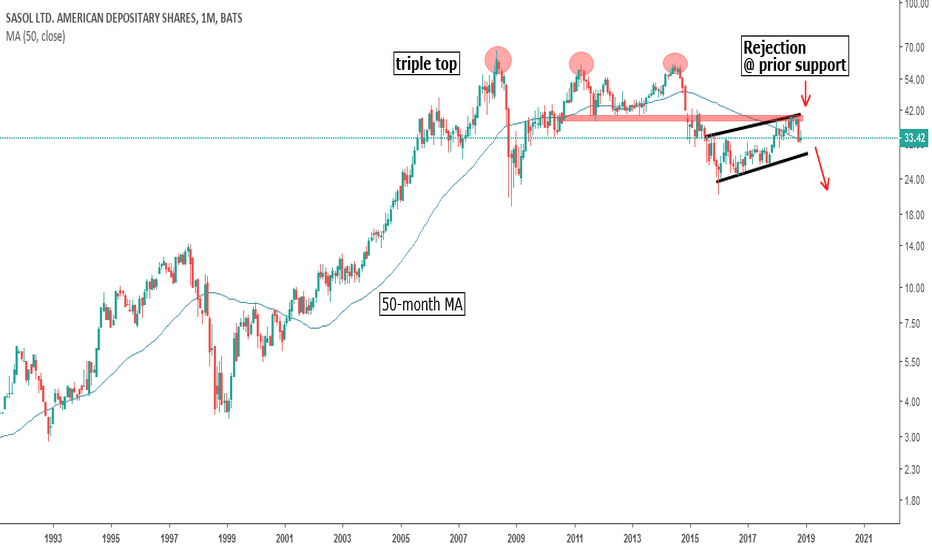
Sasol ADR Monthly, $33.42 - Triple Top: May '08, April '11 & July 14 - Since declining from $60, the share has developed a bear flag pattern. - Recently we have seen the price being rejected at the upper boundary of the channel (flag). - Bear flag break targets $21 over LT.


