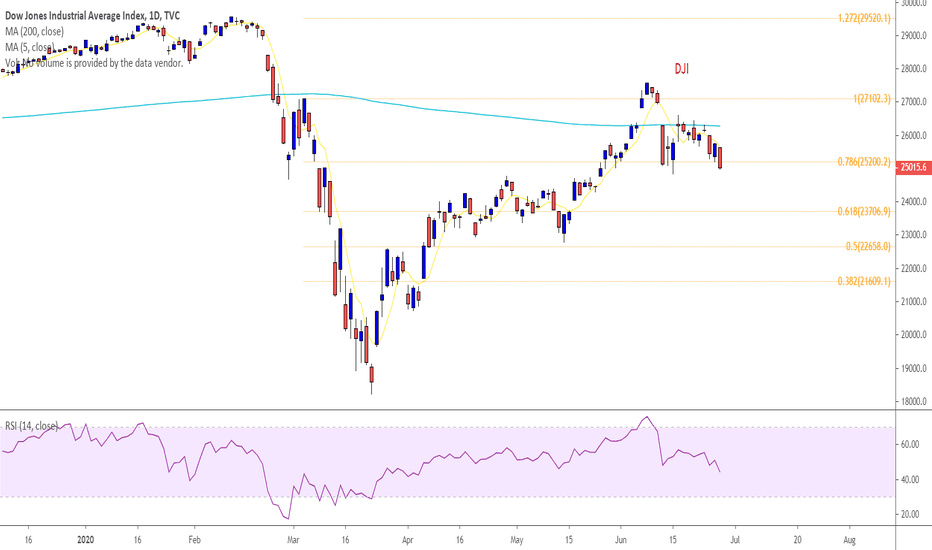
After reaching the Fibonacci resistance area and a week ago it was unable to pass its long-term Moving Average resistance. DJI is corrected to the Fibonacci support area of 25200. Open the potential to test the support area 24776 24460, 23700
Despite all the news in Indonesia, we can look at the chart that IDR weakening to USD. USDIDR now at 14110. facing its near resistance at 14134 then 14183, 14200. If price can break above this area, most likely it will test 14280.
IHSG on May, 18 2019 close at 5826. Has dropped 810 points since April 18, 2019. Measuring support with fibonacci. Next suppot at area 5774 then 5678.
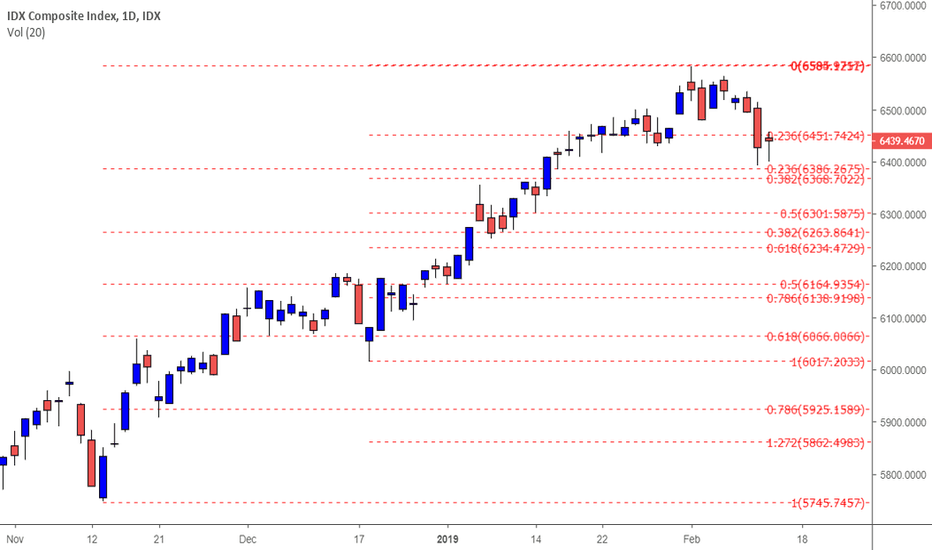
IHSG now at 6405. theres 2 scenario for IHSG movement. First scenario is up. to 6530 6582 6648 even make a new all time high second scneario is down to 6337 6225.
Support IHSG based on fibonacci retracement at 6386
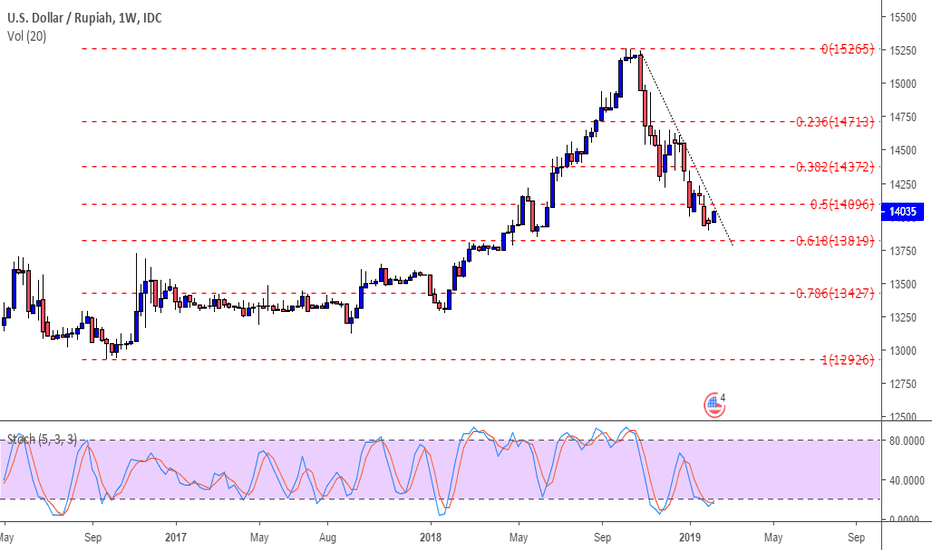
USDIDR weekly support fibonacci retracement 61.8% at area 13.827. most likely price will rebound from this area at tested closest resistance14096.
EXCL monthly support at area 1900-2000. Weekly resistance at 2240. Price has potenstial to go testing next resistance at first 2450 then next 2620.
Support resisatnce bsed on fibonacci cluster. Support at 7300. resistance at 7950, 8250
BMRI next resistance based on fibonacci at area 7600, 8000
i'm measuring TLKM support with some fibonacci measurement. fibonacci fan, projection and retracement. Measurement result for cluster support at price area 3750, 3680
EURUSD at daily time frame since November 2018 has a triangle pattren. Now price has broken above the trendline. The target of triangle pattern is in the area 1.16649. measured using Fibonacci.
BMRI support at 7100 (confluence between MA 200 and fibonacci level ), closest resistance at 7600 , 7725 (based on fibonacci level, trendline and window)
I measure TLKM swing from 3610 and 4110 and also from the last swing using fibonacci retracement. Next resistance at 3920, 4003 and 4110.
I draw somer of trendline based on peak and trough. To find some support resistance. The closest TLKM resistance is at 3925 and closest support at 3683.
BRPT in weekly going uptrend. resistance area measured by fibonacci is at 2250 then 2433. I use 2 fibonacci measurement to look for cluster resistance.
I use some Fibonacci measurements to look for JCI daily support. Support is at the level 5753-5731, 5701- 5685, 5623.


