BTC 4 hours waiting for breakout Lets see how it goes
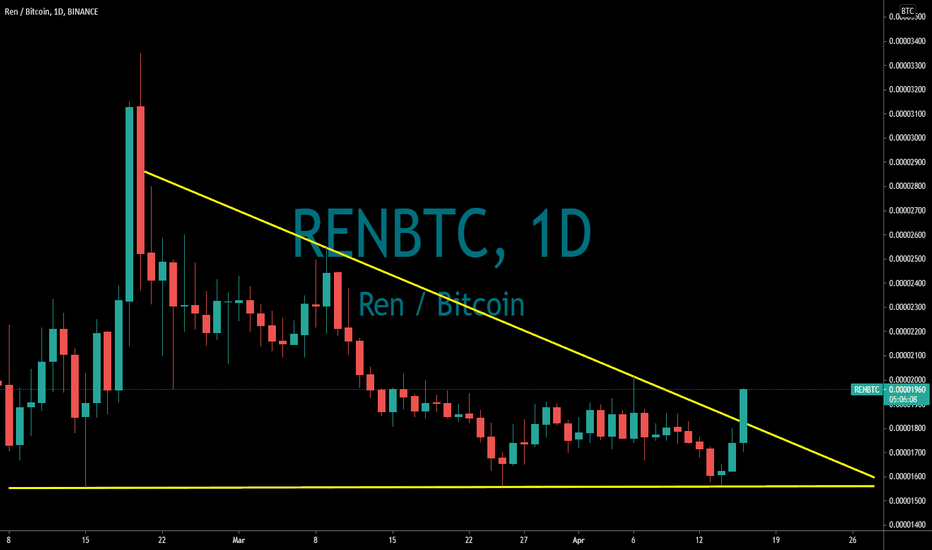
RENBTC Looks bullish on 1 day chart Breakout from the daily triangle Big pump soon?
Bitcoin getting close to critical point on a monthly chart at around 10800-11000 USD. Will the bulls break the monthly triangle or are we going to see a reverse soon before the halving? Meanwhile alts season is here, enjoy profits but always keep in mind this party will over once bitcoin will start move aggressively BITMEX:XBTUSD
BITCOIN decision time to be bullish or bearish . Winter is around the corner. Will the bulls control or the bears? Lets wait for the triangle to break
Bitcoin on monthly chart - The big picture If Monthly triangle will not be break to the up side we might see further sideways until next year and more volatility. If triangle will break to up side, it might be the next bull run. (Hopefully) Please leave comment what you think, thanks
ALTS VS Bitcoin during 2017 Bull Run
Daily ichimoku cloud just breakout. EMA + DMI + RSI positive and Strong momentum Buy: 610-650 Sell at 774,868,936,1097,1268 Stop: 600
Looking at daily chart WTC has break the triangle and look ready for a boost. Stochastic + MACD + DMI are ready to go and set. Lets see how it goes. Very good potential in my opinion 30-50% Gain or more in the short - mid term
#DLT/BTC #Binance #Long #Entry: 2700-2800 #Exit: 3250,2567,2883,4332,4906 #SL: 2550 Pattern and Signal: Daily EMA + DMI + RSI Bullish DecisionPoint Price Momentum Oscillator turned green today > Bullish sign as well Momentum is strong
#WTC/BTC #Binance #Long #Entry: 3100-3300 #Exit: 3692,4033,4373,4858,5476 #SL: 3000 Pattern and Signal: Daily EMA + DMI + RSI Bullish Just finished Head & shoulders pattern - daily chart


